Half of 2026 is now banked, and the most-repeated claim about it — that Meta has overtaken Google in advertising — is still not true on the numbers either company reports. In the second quarter of 2026 Meta booked $59.36 billion of advertising revenue. Alphabet booked $81.63 billion. The crossover everyone is quoting is an eMarketer forecast, on a narrower net digital-ad-revenue measure, for a year that is not finished. Both facts are in this page, next to each other, with the filings behind them.
This is the August edition, rebuilt on Meta's Q2 2026 results, with a September link pass. Deeper single-metric cuts now live on their own pages: Meta CPM by objective, region and season, Australian Meta CPM in AUD, and the search-side Google Ads CPC by industry and LinkedIn Ads benchmarks tables. The next full refresh follows Meta's Q3 2026 results in late October.
This is the August refresh, rebuilt on Meta's Q2 2026 results. Verified benchmark numbers across spend, audience, performance, creative, and automation — pulled from Meta's own earnings releases and investor decks, Alphabet's earnings release, eMarketer, DataReportal, Tinuiti, WordStream, Triple Whale, Lebesgue, Gupta Media, Pew, AppsFlyer, Sensor Tower, and Adjust. Every stat carries its scope and its date, because a benchmark without a window is a rumour. Grab the number you need, quote it, link back.
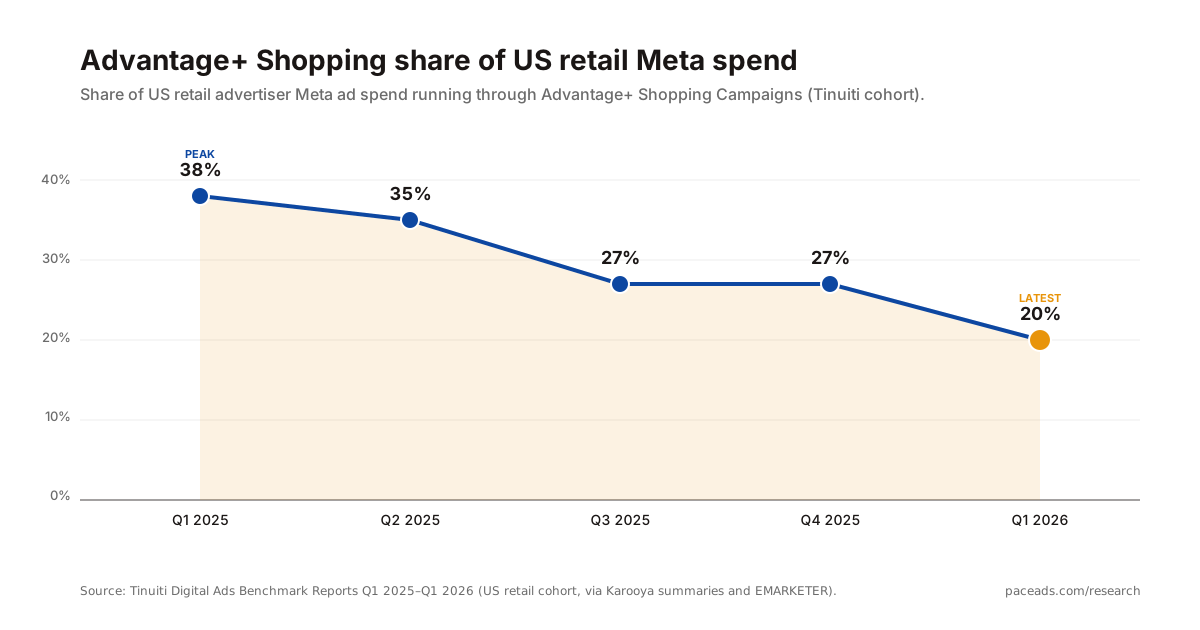
Three shifts to care about: Meta's ad revenue grew 27% in Q2 2026 on pricing rather than inventory, published Meta CPM benchmarks now differ by more than 2× depending on whose panel you read, and Advantage+ Shopping's share of US retail ad dollars fell from a 38% peak to 20% even as the wider Advantage+ suite passed a $75 billion run rate.
1. Spend & market size
Meta advertising revenue
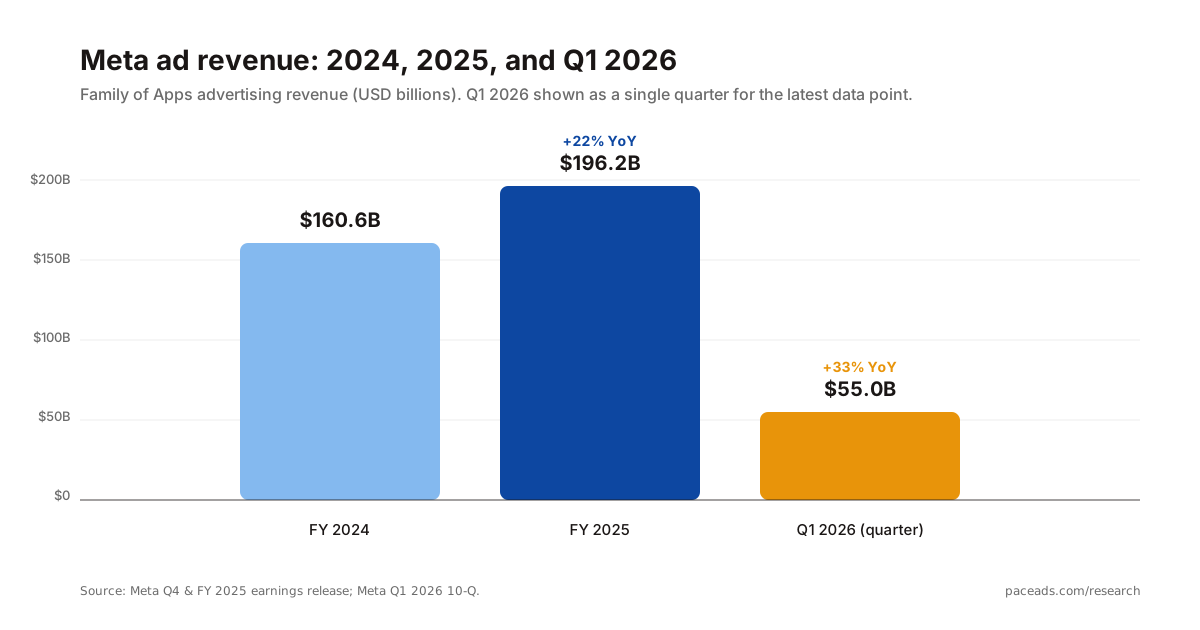
- $196.18 billion. Meta's full-year 2025 advertising revenue, up 22% versus 2024 and 97.6% of total company revenue. (Meta Q4 & FY 2025 earnings release, 28 January 2026.)
- $58.14 billion. Meta's Q4 2025 advertising revenue, up 24% year-over-year. (Meta Q4 2025 earnings release.)
- $55.02 billion. Meta's Q1 2026 advertising revenue, up 33% year-over-year; total company revenue was $56.31 billion, also +33%. (Meta Q1 2026 earnings release, 29 April 2026.)
- $59.36 billion. Meta's Q2 2026 advertising revenue, up 27% year-over-year (26% in constant currency), against total company revenue of $60.80 billion (+28%). This is the most recent quarter Meta has reported as of August 2026. (Meta Q2 2026 earnings release, 29 July 2026.)
- $114.39 billion. Meta's first-half 2026 advertising revenue, up 30% on the $87.96 billion it booked in the first half of 2025. (Pace calculation from Meta's reported quarterly figures in the Meta Q2 2026 earnings presentation.)
- +18% / +6%. Meta's Q4 2025 Family of Apps ad impression growth and average price-per-ad growth, year-over-year. (Meta Q4 2025 earnings release.)
- +19% / +12%. Meta's Q1 2026 ad impression and average price-per-ad growth, year-over-year. (Meta Q1 2026 earnings release.)
- +14% / +12%. Meta's Q2 2026 ad impression and average price-per-ad growth, year-over-year. Impression growth decelerated from +19% while pricing held at +12%, so Q2 revenue growth leaned on price rather than added inventory. (Meta Q2 2026 earnings release.)
- +20% / +10% / +1% / +21%. Meta's Q2 2026 average price-per-ad growth by user geography — US & Canada, Europe, Asia-Pacific, and Rest of World. US & Canada pricing accelerated for the third straight quarter; Asia-Pacific pricing is effectively flat. (Meta Q2 2026 earnings presentation.)
- $26.34bn / $14.09bn / $10.85bn / $8.09bn. Meta's Q2 2026 advertising revenue by user geography — US & Canada, Europe, Asia-Pacific, and Rest of World. North America is 44% of Meta's global ad revenue on roughly a tenth of its daily audience. (Meta Q2 2026 earnings presentation.)
Market share versus Google
The Meta-passes-Google headline is real but conditional, and the condition matters. eMarketer's crossover is a forecast, published in April 2026, on net worldwide digital ad revenue — a modelled measure that nets out partner payouts and counts only what eMarketer classifies as digital advertising. Alphabet's reported “Google advertising” line is gross and includes Google Network, the partner-site business Meta has no equivalent of. On reported revenue Google is still comfortably ahead. Both numbers are below; quote whichever one your claim actually needs, and say which.
- $243.46 billion vs $239.54 billion. Forecast 2026 net worldwide digital ad revenue for Meta (26.8% share) versus Google (26.4%), the first projected reversal on this measure. Published 13 April 2026 — a forecast, not a result. (eMarketer press release; Marketing Dive.)
- $214.06 billion vs $196.17 billion. Google versus Meta full-year 2025 net worldwide digital ad revenue — the most recent completed year, on the same eMarketer measure. Google led by $17.9 billion. (eMarketer.)
- $81.63 billion vs $59.36 billion. Alphabet's reported Google advertising revenue versus Meta's reported advertising revenue in Q2 2026 — the gross, as-filed comparison. Google advertising splits into Search & other $63.27bn, YouTube ads $11.06bn, and Google Network $7.30bn. (Alphabet Q2 2026 earnings release; Meta Q2 2026 earnings release.)
- +14.4% vs +27%. Year-over-year growth in Google advertising and Meta advertising revenue in Q2 2026. Meta is growing from a smaller base at close to twice the rate, which is what makes the eMarketer forecast plausible even though the reported gap is still $22 billion a quarter. (Alphabet Q2 2026 earnings release; Meta Q2 2026 earnings release.)
- 22.1% → 24.1%. Meta's forecast worldwide ad-revenue growth rate from 2025 to 2026, more than double Google's projected 11.9%. (eMarketer 2026 forecast.)
- 62.3%. Combined Meta, Google, and Amazon share of total worldwide digital ad spend forecast for 2026. (eMarketer 2026 forecast.)
- $32.03 billion. Instagram's 2025 US ad revenue (+24.4% year-over-year), passing half of Meta's US ad revenue for the first time at 50.3% share. (eMarketer press release.)
- ~$18 billion. Meta's 2024 advertising revenue from China-based advertisers, roughly 10% of global ad revenue, per internal documents reviewed by Reuters. (Fortune, December 2025.)
Revenue per person
- $16.86. Meta's worldwide Family average revenue per person (ARPP) in Q2 2026, up 24% from $13.65 in Q2 2025 and up 42% from $11.89 in Q2 2024. Meta defines ARPP as Family of Apps revenue for the quarter divided by average DAP over that quarter. (Meta Q2 2026 earnings presentation.)
- $12.36 → $13.65 → $14.46 → $16.56 → $15.66 → $16.86. Meta's Family ARPP across the six quarters from Q1 2025 to Q2 2026. The Q1 2026 dip is seasonal — Q4 carries holiday demand — not a monetisation reversal. Summed, 2025's four quarters give a full-year ARPP of $57.03. (Meta Q2 2026 earnings presentation.)
2. Audience & reach
Daily active people
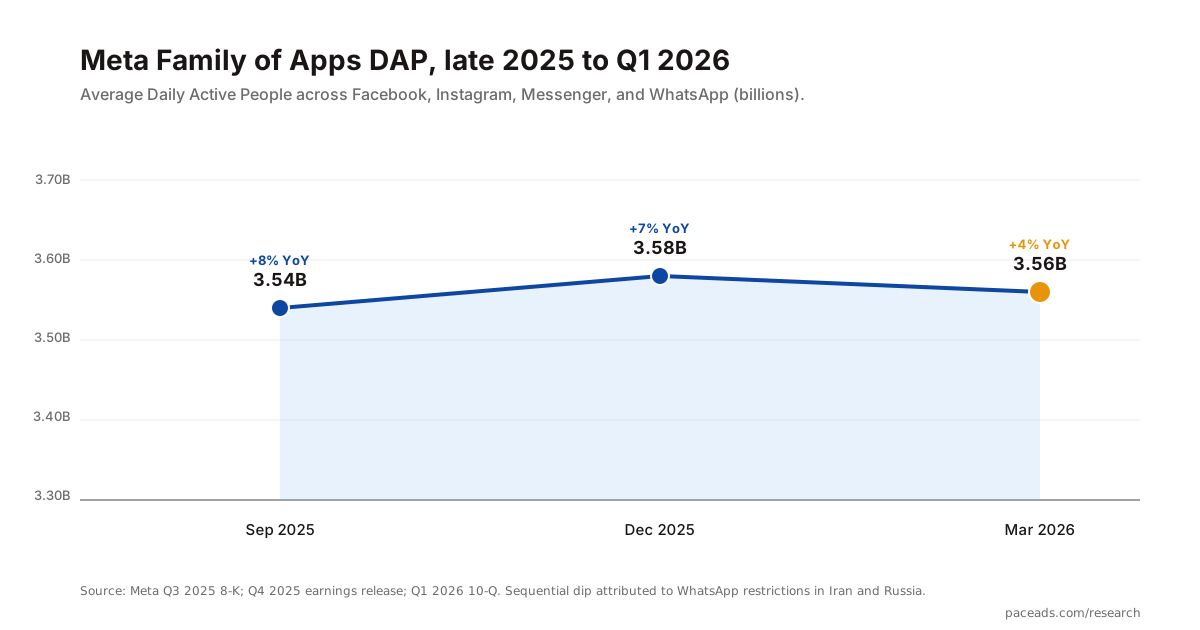
- 3.60 billion. Average Family Daily Active People (DAP) across Facebook, Instagram, Messenger and WhatsApp in June 2026, up 3% year-over-year. (Meta Q2 2026 earnings release.)
- 3.58bn → 3.56bn → 3.60bn. Meta's Family DAP for December 2025, March 2026 and June 2026. The one sequential decline in the series is not a reporting error and not organic churn: Meta attributes it to internet disruptions in Iran, “which were largely restored in the second quarter of 2026”, plus a restriction on access to WhatsApp in Russia. DAP recovered to a record 3.60 billion the following quarter. (Meta Q2 2026 earnings presentation, DAP footnote.)
Platform user counts
- 2 billion. Instagram daily active users, a milestone Mark Zuckerberg announced on the Q2 2026 earnings call. Instagram passed 3 billion monthly active users in September 2025. (Meta Q2 2026 earnings call; TechCrunch.)
- 2 billion+ / 3 billion. Facebook daily active users and WhatsApp monthly active users as of Q2 2026. WhatsApp set an all-time messaging record during the 2026 World Cup Final, peaking at 30 million messages sent per second. (Meta Q2 2026 earnings call; TechCrunch.)
- 500 million+. Threads monthly active users as of Q2 2026, up from 400 million in August 2025 and 150 million daily actives in Q3 2025. Zuckerberg called it “the fastest growing conversation app ever”. (Meta Q2 2026 earnings call; TechCrunch; Social Media Today.)
Advertising audience reach
- 2.28 billion. Facebook advertising audience reach in January 2025: 27.9% of the global population, 41.1% of internet users, up 93.3 million people (+4.3%) year-over-year. This remains DataReportal's most recent published Facebook reach snapshot as of August 2026. (DataReportal / Kepios, updated March 2025.)
- 1.74 billion. Instagram advertising audience reach in January 2025, up 90.8 million people (+5.5%) year-over-year — faster growth than Facebook (+4.3%). Also DataReportal's most recent published Instagram snapshot as of August 2026. (DataReportal / Kepios, updated March 2025.)
- 414m / 172m / 141m. Instagram's largest advertising audiences by country in early 2025 — India, the United States, and Brazil. India's Instagram base is more than double the US base. (DataReportal.)
- 56.9% / 55.1%. Share of online adults aged 16+ globally who use Facebook and Instagram each month, ranking #1 and #3 worldwide outside China. (DataReportal Digital 2026.)
- 17.4% / 16.4% / 13.0%. Share of users naming WhatsApp, Instagram, and Facebook as their favourite social platform. Meta owns the top three brand-preference spots globally. (DataReportal / GWI.)
- 71% / 50%. Share of US adults who use Facebook and Instagram. Among 18–29s, Instagram leads at 80%. (Pew Research, November 2025.)
3. Performance benchmarks
This is the section people quote and the section people get wrong. Below are four separate published “Meta CPM” figures that differ by more than 2×. None of them is fabricated and none of them is a correction of the others — they measure different things, and an answer engine that picks one at random will mislead whoever asked. Read the reconciliation before you quote the number.
Meta CPM benchmarks — and why they disagree
- $14.19. Median Meta CPM across roughly 35,000 ecommerce brands in calendar 2025, up 20% year-over-year. Ecommerce-only panel, all objectives, worldwide. (Triple Whale.)
- $10.88. Average Meta CPM in Q1 2025 only, up 19.2% year-over-year, across a panel of 6,000+ companies and roughly $4 billion of annual spend spanning ecommerce, SaaS and services. Mean rather than median, and a single quarter rather than a year. (Right Side Up using Varos.)
- $16.08. Median US Facebook CPM for ecommerce advertisers, the most expensive of 52 country markets benchmarked. Single-country, ecommerce, published 27 July 2026. (Lebesgue.)
- $8.19 / $13.42. Full-year 2025 average Facebook CPM and the peak weekly CPM during Thanksgiving / Black Friday 2025, from a public tracker spanning all objectives including cheap reach and awareness inventory. Blending brand objectives in is what pulls this figure below the ecommerce panels. (Gupta Media tracker.)
- −13% aggregate, but +YoY for 44% of advertisers. Facebook CPM change in Q4 2025 across Tinuiti's client cohort. The aggregate fell as cheap Reels inventory expanded, while nearly half of individual advertisers still saw their own CPM rise. Aggregate CPM movements and per-account CPM movements are not the same measurement. (Tinuiti Q4 2025 Digital Ads Benchmark Report.)
How to reconcile them. Four variables explain the whole 2.7× spread, and all four are legitimate. Panel composition: Triple Whale and Lebesgue sample ecommerce advertisers, who buy expensive conversion inventory; Gupta Media's tracker blends in reach and awareness objectives that clear at a fraction of the price. Geography: a worldwide median mixes $16 US impressions with $1.36 Indian impressions, so any global figure is really a statement about a panel's country mix. Window: a single-quarter mean (Right Side Up, Q1 2025) and a full-year median (Triple Whale, 2025) will not match, and Q4 pricing alone can run 60% above the annual average. Central tendency: medians and means diverge sharply on a distribution this skewed. The practical rule: never quote a Meta CPM without naming the panel, the country and the objective, and only compare your own CPM against a benchmark that matches all three.
Meta CPM by country
The single most-requested cut of this data, and the one most rarely published in full. The table below is Lebesgue's July 2026 ecommerce benchmark set, which covers 52 markets; a representative selection is reproduced here. These are ecommerce medians — lead-generation and awareness campaigns in the same markets typically clear lower. Lebesgue does not publish a sample size or a precise collection window for this set, so treat the ordering as more reliable than the absolute values.
| Country | Facebook CPM (USD) | Index vs US |
|---|---|---|
| United States | $16.08 | 100 |
| United Kingdom | $11.81 | 73 |
| Australia | $11.63 | 72 |
| Canada | $11.47 | 71 |
| United Arab Emirates | $10.00 | 62 |
| Germany | $9.05 | 56 |
| New Zealand | $9.01 | 56 |
| Netherlands | $8.58 | 53 |
| Sweden | $8.12 | 51 |
| Singapore | $7.21 | 45 |
| France | $6.95 | 43 |
| Japan | $6.73 | 42 |
| Spain | $6.65 | 41 |
| Italy | $6.06 | 38 |
| South Korea | $5.80 | 36 |
| Poland | $5.55 | 35 |
| Malaysia | $5.39 | 34 |
| Mexico | $3.92 | 24 |
| Philippines | $3.40 | 21 |
| South Africa | $2.99 | 19 |
| Brazil | $2.63 | 16 |
| Colombia | $2.00 | 12 |
| Egypt | $1.81 | 11 |
| India | $1.36 | 8 |
Source: Lebesgue Facebook CPM by country, published 27 July 2026. Ecommerce medians. Index calculated by Pace.
- 11.8×. The spread between the most and least expensive Meta markets in the July 2026 benchmark set — $16.08 in the United States against $1.36 in India. The English-speaking markets cluster tightly: UK $11.81, Australia $11.63, Canada $11.47, New Zealand $9.01. (Lebesgue, July 2026.)
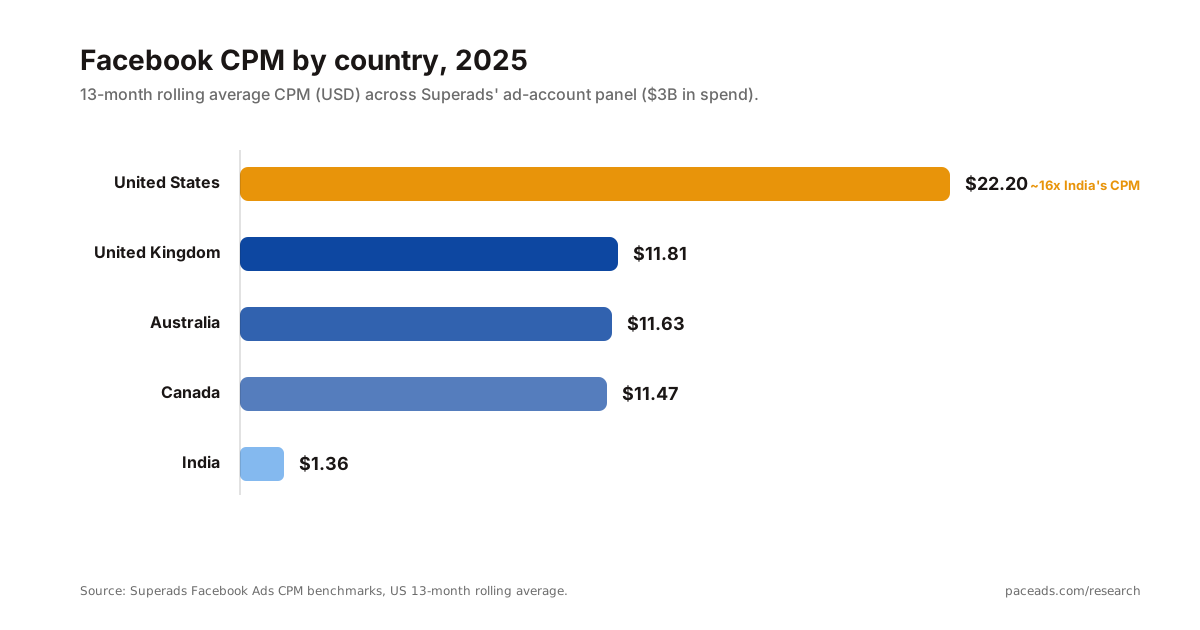
- $3 billion+ of spend, rolling 13 months. The basis of a second widely-cited country CPM set, which reports a higher US figure than the ecommerce-only benchmarks above. Its window rolls forward continuously; the edition we read covered data through July 2026. If you quote it, quote the window with it. (Superads.)
Ecommerce CPM, CPA and ROAS
- +8% to +38%. Range of year-over-year CPM increases across every ecommerce vertical in 2025. Health & Wellness was steepest (+38%); Food & Beverage softest (+8%). No vertical got cheaper. (Triple Whale.)
- 2.19% / 1.86x / $38.19. Median CTR, ROAS and CPA on Meta across roughly 35,000 ecommerce brands in 2025. CTR rose 13.5% year-over-year while ROAS held roughly flat — higher CPMs were absorbed by better click and conversion rates rather than by worse returns. (Triple Whale.)
- 2.54x / $49.48 / $29.99. Best ecommerce ROAS by vertical (Automotive), highest CPA (Electronics) and lowest CPA (Lifestyle & Boutique) on Meta in 2025. (Triple Whale.)
CPC and CTR benchmarks
- 1.71% / $0.70. 2025 median CTR and CPC on US Meta traffic campaigns. CTR rose 9% year-over-year while CPC fell 7%, from 1.57% / $0.77. (WordStream / LocaliQ.)
- $0.49 / 1.80%. Overall median Facebook Ads CPC and CTR across more than 150,000 client reports from 7,000+ agencies, published January 2025. Roofing had the highest median CPC at $1.73; Weddings & Events led CTR at 3.01%. The far lower CPC versus WordStream's traffic-campaign figure reflects a broader objective mix that includes cheap engagement clicks. (AgencyAnalytics.)
CPL and conversion-rate benchmarks
- $27.66 / 7.72%. 2025 median CPL and conversion rate on Meta lead-generation campaigns. CPL rose 21% year-over-year while conversion rate fell from 8.67% — the worst combination in the benchmark set. (WordStream / LocaliQ.)
- $76.71 vs $3.16. Highest and lowest median Meta CPL by industry in 2025 — Dentists/Dental against Restaurants/Food, a 24× spread. Dentists also carried the highest lead-campaign CPC at $9.78. Restaurants led conversion rate at 18.25%; Furniture trailed at 3.77%. (WordStream.)
Advertiser spend growth
- Instagram +21%, Facebook +9%. Year-over-year Meta ad-spend growth across Tinuiti's client cohort in Q3 2025. Instagram CPM rose double-digits for the sixth straight quarter. (Tinuiti Q3 2025.)
- 14% → 9%. Deceleration in Meta ad-spend growth across Tinuiti's cohort from Q3 to Q4 2025, with Facebook spend growth falling from 9% to 3%. Note that this cohort decelerated in the same quarter Meta's own reported ad revenue accelerated to +24% — agency cohorts skew toward established US retail and are not a proxy for Meta's global book. (Tinuiti Q4 2025.)
4. Creative & ad formats
Reels
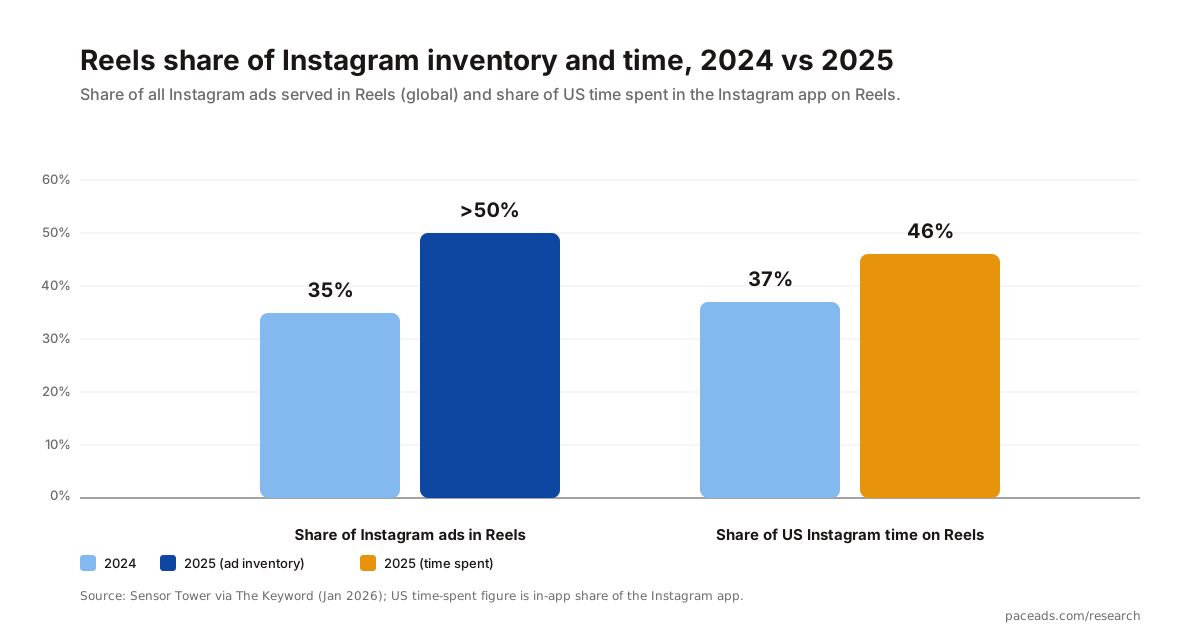
- >50%. Share of all Instagram ads that ran in Reels during 2025, up from roughly 35% in 2024, measured across Sensor Tower's app panel. (Sensor Tower, reported by CNBC, January 2026.)
- 46% / 29%. Share of US time spent in the Instagram app that went to Reels in 2025 (up from 37% in 2024), and share of all Facebook ads that ran in Reels globally in 2025. (Sensor Tower, reported by CNBC.)
- 26% → 29% → 33% → 35%. Reels' share of Instagram ad impressions across Tinuiti's client cohort from Q3 2025 to Q2 2026. Facebook Reels reached 16% of Facebook impressions in Q4 2025. This runs well below Sensor Tower's “>50%” because the two count different things: Sensor Tower measures the share of distinct ads observed in its panel, Tinuiti measures the share of impressions delivered by its own clients, who skew to established Feed-first retail advertisers. Both are correct; they are not interchangeable. (Tinuiti Q4 2025; Q1 2026; Q2 2026.)
- $50 billion+. Combined Instagram and Facebook Reels annual revenue run rate, disclosed by Mark Zuckerberg on Meta's Q3 2025 earnings call. (Tubefilter.)
- +9% / +10%. Facebook video time-spent growth globally and in US & Canada in Q2 2026, with Instagram global time spent growing double digits year-over-year. Meta attributes both to Feed and Reels ranking improvements, including what it called its largest single-release Reels ranking improvement to date. (Meta Q2 2026 earnings call.)
- ~10%. Share of daily Reels views in Q4 2025 produced via Meta's Edits app, which launched in April 2025. (About Meta, January 2026.)
Messaging and click-to-message ads
- +50% / +60%. US click-to-message ad revenue growth in Q4 2025 and global click-to-WhatsApp ad revenue growth in Q3 2025, both year-over-year. WhatsApp paid business messaging passed a $2 billion annualised run rate in Q4 2025. (About Meta; Storyboard18.)
- $1 billion, +73%. Meta's Family of Apps “other” revenue in Q2 2026 — the line that carries WhatsApp paid messaging and subscriptions — crossing $1 billion in a quarter for the first time. Small against $59.36 billion of advertising, but growing nearly three times faster. (Meta Q2 2026 earnings call.)
- 1 million+. Businesses using Meta Business Agents on WhatsApp and Messenger to talk to customers or complete sales every week, following the global rollout in Q2 2026. (Meta Q2 2026 earnings call.)
New ad surfaces
- Threads, globally. Meta completed its global ads expansion on Threads in Q2 2026, and expanded WhatsApp Status ads to support more ad destinations and advertiser performance goals ahead of a global rollout. These are the two meaningful new inventory pools opening to advertisers in 2026. (Meta Q2 2026 earnings call.)
5. Targeting & automation
Advantage+
- 38% → 27% → 20%. Advantage+ Shopping Campaigns' share of US retail Meta ad spend across Q1 2025, Q4 2025, and Q1 2026, on Tinuiti's client cohort. This is a dollar-share measure and it is falling. It is not in conflict with rising Advantage+ account adoption — the share of accounts that run at least one Advantage+ campaign has kept climbing over the same period. More accounts are switching it on; each is putting a smaller slice of its budget through it. Adoption breadth and budget share are different metrics and they are currently moving in opposite directions. (Tinuiti Q4 2025; Tinuiti Q1 2026; summary via Karooya.)
- $20bn → $60bn → $75bn+. Annual revenue run rate of Meta's end-to-end automated ad solutions — the broader Advantage+ suite — at Q4 2024, Q3 2025 and Q2 2026. The suite is growing fast even as one campaign type inside it loses budget share. (Marketing Dive on Meta Q3 2025; Meta Q2 2026 earnings call.)
- 14% lower CPL. Meta's reported average cost-per-lead improvement for advertisers using Advantage+ across sales, app, or lead campaigns in Q3 2025. Meta-reported, aggregate, opt-in population. (Meta Q3 2025 earnings call.)
- +13% / +16%. Incremental lift in purchases and increase in add-to-cart conversions reported for Undernet, an Indian online apparel brand, after moving from manual campaign setup to Advantage+ sales campaigns layered with Advantage+ Audience, Placements and Budget optimisation. A single Meta-selected case study, quoted on the Q2 2026 call. (Meta Q2 2026 earnings call.)
Generative AI creative tools
- 1m → 4m → 9m. Advertisers and small businesses using at least one of Meta's generative AI ad creative tools, from mid-2024 to Q4 2024 to Q2 2026. Adoption of image generation alone more than doubled in Q2 2026, helped by a new ability to create images from existing video assets. (Marketing Dive; Meta Q2 2026 earnings call.)
- +20% quarter-on-quarter. Growth in advertisers using at least one of Meta's video-generation features inside Advantage+ creative in Q3 2025. (Meta Q3 2025 earnings call.)
Andromeda & ad ranking
Andromeda is the retrieval stage: the model that narrows tens of millions of eligible ads down to the shortlist that reaches the auction. It sits upstream of the ranking models, which score whatever Andromeda hands them. Advertisers who noticed their delivery change in late 2025 were mostly noticing retrieval, not bidding. Meta has never published a dated completion milestone for the global rollout, so any specific rollout date you see quoted is third-party inference — we have left it out rather than repeat it.
- 10,000× model capacity. The increase in Meta's Andromeda ad-retrieval engine versus its predecessor, alongside +6% recall and +8% ads quality on selected segments, as announced by Meta in December 2024. Andromeda runs on NVIDIA Grace Hopper hardware at the retrieval stage. (Engineering at Meta, 2 December 2024.)
- +3.5% / +1%. Lift in Facebook ad clicks and Instagram conversions in Q4 2025 from Meta's GEM (Generative Ads Recommendation Model) ad-ranking update, after Meta doubled the GPUs used to train it. (About Meta, January 2026.)
- +8.3% / +15.7%. Increase in ad clicks and uplift in conversions on Facebook in Q2 2026, which Meta attributes to advances in its user-understanding models combined with GEM ads ranking and sequence learning. Two quarters on from the +3.5% / +1% figures above, the reported ranking gains are roughly four times larger. (Meta Q2 2026 earnings call.)
- Meta Generative Recommender. Introduced in Q2 2026, this is the first generative model Meta has deployed into its ads retrieval system — the successor layer to Andromeda's approach. Rather than scoring every possible ad individually, it reasons about ad content and user preferences together and predicts the best ad per person. Early LLM pilots on user preferences drove a 1% increase in app event conversions on Instagram. (Meta Q2 2026 earnings call.)
Measurement & privacy signal
- 17.8% / two-thirds. Meta's reported lower cost-per-result for advertisers running Conversions API on web events versus Pixel-only, and the share of advertisers reporting improved ROAS after implementing CAPI in IAB's October 2025 industry guide. (PPC Land; IAB.)
- 35% vs 50%. Industry-wide iOS ATT opt-in rate in Adjust's 2025 mobile-app panel against AppsFlyer's 50% global figure from Q1 2024. Neither is Meta-specific; the gap reflects different panel weightings and different measurement years. (Adjust; AppsFlyer.)
- $10 billion. Meta's 2022 estimate of Apple's App Tracking Transparency impact on its annual revenue, originally stated by Mark Zuckerberg on the Q4 2021 earnings call in February 2022. Meta has not refreshed the figure publicly since, and it should be read as a four-year-old estimate against a business that has more than doubled: 2024 ad revenue was $160.6 billion, 2025 was $196.18 billion. (Yahoo Finance.)
Regulation & policy
- January 2026. The month Meta began offering EU users on Facebook and Instagram an alternative, less personalised advertising experience, following a €200 million ($216 million) European Commission fine in April 2025 over its earlier pay-or-consent model under the Digital Markets Act. EU ad revenues were $21.61 billion in 2024 and are forecast to reach $30.77 billion by 2027. (eMarketer, December 2025.)
- January 2025. The month Meta expanded its Special Ad Categories to add Financial Products and Services (replacing “Credit”). US advertisers in Housing, Employment, and Financial Products face restricted age and gender targeting, blocked Lookalikes, and a 15-mile minimum ZIP-code radius. Still in force in 2026. (Data Axle / Meta policy update.)
- $2.4 billion. Charges related to legal proceedings recognised in Meta's Q2 2026 general and administrative expenses — a large enough item to cut reported operating income 8% year-over-year despite 28% revenue growth. CFO Susan Li flagged continuing scrutiny on youth-related issues in several markets and youth-related trials scheduled in the US that “may ultimately result in a material loss”. (Meta Q2 2026 earnings release; Meta Q2 2026 earnings call.)
6. Where automation stops winning
Every number above says Meta's automation is compounding: a $75 billion Advantage+ run rate, ranking gains four times bigger than two quarters ago, nine million businesses on generative creative tools. Then you look at the two independent incrementality datasets that tested automation against manual campaigns on outcomes rather than platform-reported results, and the story inverts. Neither of these came from Meta. Both stopped the research team for a beat.
- $257 → $528. New-customer acquisition cost via Advantage+ in the Wicked Reports dataset (55,661 Meta campaigns) jumped from $257 in May 2024 to $528 in May 2025. Manual campaigns over the same window got cheaper. (Wicked Reports.)
- 42% vs 58%. Share of 640 incrementality tests — run over 18 months by Haus across mid-market and enterprise brands averaging roughly $1M/month in Meta spend — where Advantage+ Shopping outperformed manual campaigns, against where manual won. Manual won the majority. (AdExchanger citing Haus.)
Two third-party datasets, two methodologies, same direction: pure automation is not the universal upgrade Meta's product pages suggest. Both studies predate the Q2 2026 ranking improvements, so they may well look different when re-run — but nobody has re-run them yet, and until someone does, the honest reading is that manual structure was still winning a meaningful share of head-to-heads on incrementality and new-customer economics as recently as 2025. The Advantage+ spend-share decline in #58 is the in-market echo of the same finding: advertisers are not abandoning automation, they are ring-fencing it. Read together with the $75 billion run rate in #59, the picture is an industry running automation and manual side by side and letting measurement decide the split — which is a more defensible posture than either camp's marketing suggests.
7. Frequently asked questions
Does Meta still use relevance score in 2026?
No. Meta retired the single 1–10 relevance score in 2019 and replaced it with three ad relevance diagnostics: quality ranking, engagement rate ranking, and conversion rate ranking. Each is reported as above average, average, or below average relative to ads competing for the same audience, and each points at a different fix — quality ranking at creative and landing-page experience, engagement rate ranking at the hook, conversion rate ranking at offer and post-click. Those three diagnostics are still what Meta Ads Manager surfaces in 2026. There is no single relevance score to optimise for any more, and any 2026 guide that tells you to “raise your relevance score” is running on 2018 information. (Meta Business Help Centre: about ad relevance diagnostics.)
What is a good Meta CPM in 2026?
There is no single answer, and anyone who gives you one has not told you their panel. Published 2026 benchmarks span roughly $8 to $22 depending on country, vertical, objective and measurement window. Anchor against a matching benchmark: US ecommerce median $16.08, UK $11.81, Australia $11.63, India $1.36 (Lebesgue, July 2026); cross-vertical ecommerce median $14.19 (Triple Whale, ~35,000 brands, 2025); all-objectives full-year average $8.19 (Gupta Media, 2025). See the reconciliation above for why these legitimately differ.
What is Meta Andromeda?
Andromeda is Meta's machine-learning ad retrieval engine — the stage that narrows tens of millions of eligible ads to the shortlist that enters the auction. Announced in December 2024, Meta reported a 10,000× increase in model capacity over its predecessor, +6% recall and +8% ads quality on selected segments. It sits upstream of Meta's ranking models: GEM scores what Andromeda retrieves, and from Q2 2026 the Meta Generative Recommender extends the same idea with a generative model deployed directly into retrieval. For advertisers the practical consequence is that creative diversity now matters at the retrieval stage, not just at ranking — a shortlist model with far more capacity can find an audience for a wider range of creatives than the old system could.
Did Meta overtake Google in advertising revenue?
Not on reported revenue. In Q2 2026 Meta booked $59.36 billion in advertising revenue against Alphabet's $81.63 billion in Google advertising revenue. The crossover you have seen quoted is an eMarketer forecast published on 13 April 2026, projecting Meta at $243.46 billion versus Google at $239.54 billion for full-year 2026 on a net worldwide digital ad revenue basis — a modelled measure that nets out partner payouts and excludes revenue eMarketer does not classify as digital advertising. It is a forecast, on a different metric, for a year that is not finished.
What is the average Meta ROAS for ecommerce in 2026?
Median Meta ROAS across roughly 35,000 ecommerce brands was 1.86x for 2025, roughly flat year over year, against a $14.19 median CPM, a 2.19% median CTR and a $38.19 median CPA. Automotive led verticals at 2.54x; CPA ranged from $29.99 in Lifestyle & Boutique to $49.48 in Electronics. Note that these are platform-reported returns, not incrementality-adjusted ones — the incrementality studies in section 6 exist precisely because those two numbers diverge.
Methodology
The May 2026 edition drew on 85 candidate stats across five themes with two independent verification passes. For this August 2026 refresh we re-checked every existing stat against its source, replaced aggregator and mirror citations with primary filings wherever the primary was reachable, added Meta's Q2 2026 results throughout, and added CPM-by-country, ecommerce, CPC/CTR/CPL and regulatory sections that the previous edition did not cover.
Things we removed rather than carried forward: a claimed October 2025 completion date for Andromeda's global rollout, which the cited Meta engineering post (dated December 2024) does not support and which we could not source to any Meta disclosure; a Gen Z Instagram time-spent figure we could only trace to a low-authority republication of eMarketer data we could not reach; and a “Reels surpassed Feed on Instagram impressions” claim that Tinuiti's own Q4 2025 report does not state. Earlier passes also dropped a frequently-circulated Advantage+ Shopping lift figure and a Madgicx conversion-rate set we could not locate in the linked article.
Sources blended, in order of weight:
- Meta and Alphabet earnings releases, investor presentations, and call transcripts for total spend, impression growth, price-per-ad, ARPP, Family DAP, and the Meta-versus-Google comparison.
- Public benchmark reports from Tinuiti, WordStream / LocaliQ, Triple Whale, Lebesgue, AgencyAnalytics, Gupta Media, Superads, and Right Side Up using Varos.
- Third-party audience analytics from DataReportal / Kepios, Pew Research, Sensor Tower, AppsFlyer, and Adjust.
- Meta's product communications (About Meta, Engineering at Meta) for product-launch metrics. These are Meta-reported and not externally audited; we flagged it where it matters.
Treat exact figures (e.g. “$16.08”) as benchmark point estimates with an implicit ±5–10% range, not audit-grade truth. Benchmark panels are self-selected populations of advertisers using a particular tool, so they are directional, not statistically representative of Meta's global advertiser base. Where Meta-disclosed lift figures appear (e.g. “14% lower CPL”, “+8.3% ad clicks”), they are aggregate self-reports and the comparison population is opt-in.
Last full source review: 15 August 2026, current to Meta's Q2 2026 results (reported 29 July 2026) and Alphabet's Q2 2026 results (reported 22 July 2026). We re-verify after each Meta earnings report.
How to cite this
If you're a journalist, marketer, or fellow performance media nerd, please link back when you cite the numbers. Suggested format:
“Pace Research, Meta Ads Statistics 2026, paceads.com/research/meta-ads-statistics-2026.”
If you'd like the raw data behind any chart or want a higher-resolution PNG/PDF version, email [email protected]. The charts on this page are free to embed with a link back.
What this means for practitioners
Three things from this roundup matter more than the rest if you actually manage paid social for a living.
First, quote your CPM with its scope or don't quote it (#32–#38). The four published Meta CPM figures in section 3 differ by 2.7× and every one of them is defensible. If your client benchmark says you're expensive, check whether the comparison is ecommerce or all-objectives, single-country or worldwide, median or mean, and which twelve months it covers. Most “our CPMs are too high” conversations dissolve at that step.
Second, Meta's growth is now priced, not stocked (#8, #9). Q2 2026 impression growth decelerated to +14% while price-per-ad held at +12%, and US & Canada pricing accelerated to +20%. When revenue growth comes from price rather than inventory, holding your cost per outcome steady depends on CTR and conversion rate improving at the same pace — which puts the pressure on creative refresh cadence and audience exclusions, not on bid tactics.
Third, run automation and manual side by side and let measurement pick (#58, #74, #75). Advantage+ Shopping's share of retail dollars fell to 20% while the broader Advantage+ suite passed a $75 billion run rate — both true, because advertisers are switching automation on more widely and trusting it with less of the budget. The incrementality data supports exactly that hedge.
The pacing problem is the same on Meta as it is on Google: you need to land your monthly budget close to target across every platform without a spreadsheet ritual at month-end. That's what Pace exists to fix — it watches month-to-date spend on your connected Meta, Google, LinkedIn, Microsoft and TikTok accounts and adjusts daily budgets to hit the target you set. Start a free trial to see it on your own accounts, or read our complete guide to paid social advertising for the manual version.