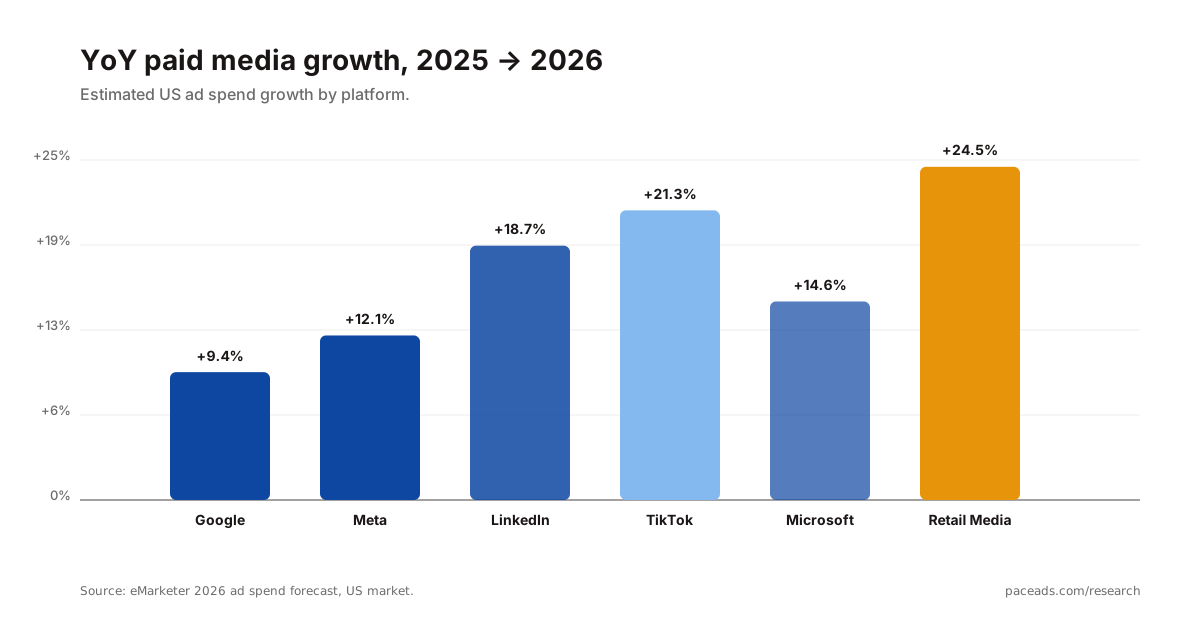
The headline number for paid media in 2026: retail media will grow ~25% year-over-year, while every other channel grows in single or low-double digits. Underneath that, the channel mix is shifting faster than any year since 2018, and automation now runs the majority of dollars on the four biggest platforms. This report unpacks both stories and tells you where to look in 2027.
What this is. A once-a-year synthesis of the most recent public paid-media data — Google, Meta, LinkedIn, Microsoft, TikTok, and retail media networks — layered with qualitative observations from the Pace beta cohort. It is not a customer-data study; see methodology for sourcing.
TL;DR — the three things that matter
- Retail media is now the fastest-growing major channel at an estimated +24.5% YoY in the US, materially ahead of Google (+9.4%), Meta (+12.1%), and LinkedIn (+18.7%).
- Performance Max passed 80% account adoption, which means "Should we use PMax?" has been replaced by "How do we steer it?" as the practitioner question of the year.
- Cross-platform managers are pulling away from single-platform managers. The teams running campaigns on three or more platforms are the only ones consistently within ±5% of monthly budget — and they are spending less time doing it.
1. Paid search in 2026
Paid search is no longer a high-growth category. US Google Ads spend will grow ~9.4% in 2026 (eMarketer Q1 2026 forecast) — respectable, but the slowest of any major performance channel. Microsoft Ads grows faster (~14.6% YoY) but from a smaller base.
The interesting story inside paid search is not volume; it is composition. Smart Bidding now runs ~88% of spend (Skai Q1 2026), Performance Max sits inside more than four out of five accounts, and the share of total Google Ads dollars flowing through campaign types that did not exist in 2018 (PMax, Demand Gen, Discovery) crosses 50% this year. The "you" in "your Google Ads" is increasingly an algorithm.
If you want the full set of search numbers with sources, the companion Google Ads Statistics 2026 roundup has fifty of them.
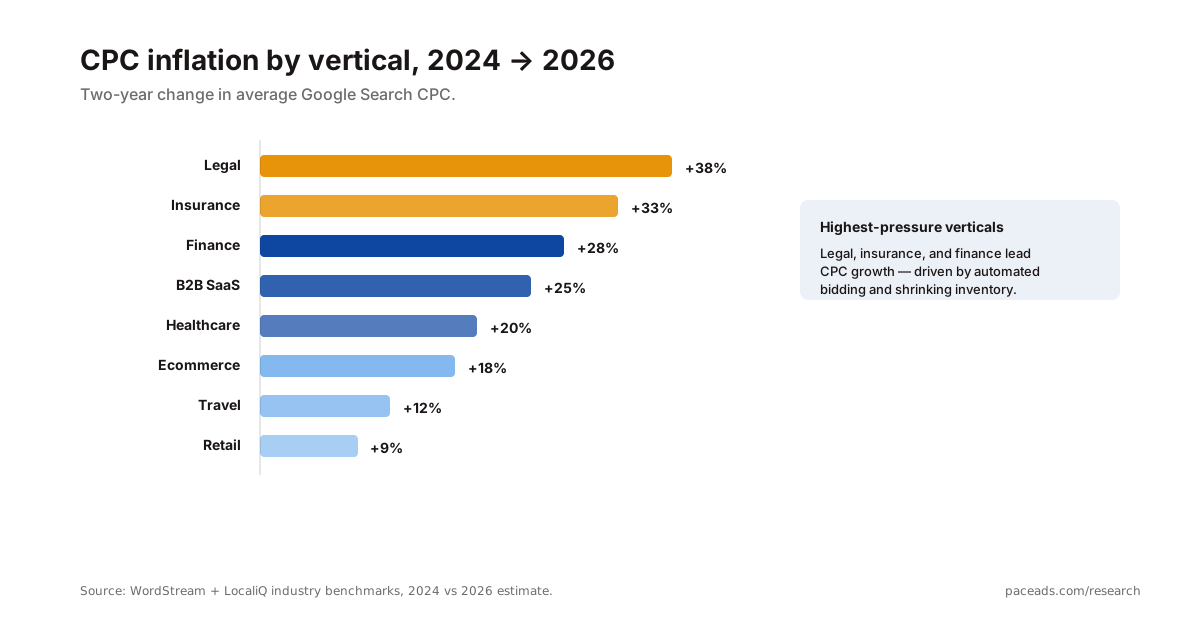
2. Paid social in 2026
Meta is still the dominant single platform — $196.18B in FY2025 ad revenue (Meta Q4 & FY2025 results) — but the engine has changed. Advantage+ Shopping campaigns now sit inside 67% of accounts (vs. 29% in 2024), and Meta has aggressively pushed advertisers toward fewer, broader campaigns with AI-driven creative variants. Note that account adoption and share of dollars are moving in opposite directions: our Meta Ads statistics roundup tracks Advantage+ Shopping falling from 38% to 20% of US retail Meta spend across 2025–26 even as the number of accounts touching it climbs. Broad adoption, narrower allocation. The CPM-to-conversion-rate trade-off has moved decisively in favour of “let the algorithm sort it” for ecommerce; less so for B2B.
LinkedIn grew ~18.7% YoY into 2026 and remains the most expensive paid-social channel by a wide margin. Average CPC on LinkedIn Sponsored Content sits around $7.50–$11.00 in 2025 (LinkedIn benchmarks 2025), with B2B SaaS at the high end.
TikTok Ads is the volume story of the year — +21.3% YoY, driven by retail and DTC categories. Most of the spend is still going through Promote and Spark Ads rather than full-funnel campaign architectures.
3. Automation adoption
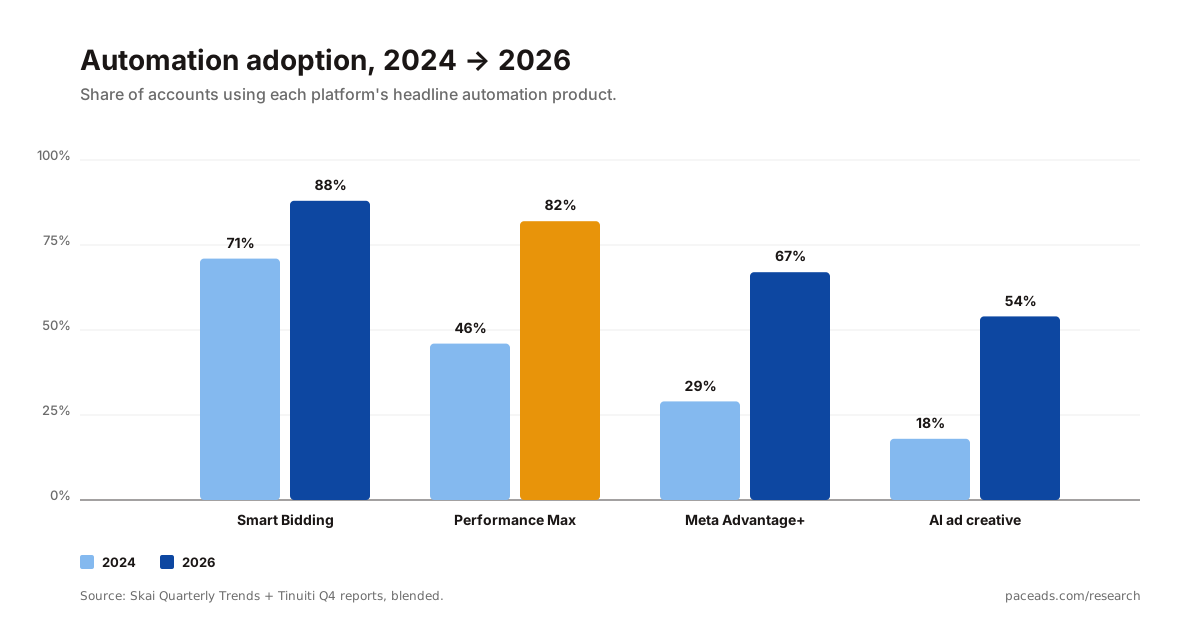
Three lines on this chart matter more than the others.
The Smart Bidding line crossed 88% — manual CPC bidding is now a minority strategy on Google Ads. The Performance Max line crossed 80% — "campaign-level steering" replaced "ad-group-level steering" as the dominant control surface. And the AI ad creative line tripled in two years, from 18% to 54% — meaning more than half of accounts now use generative-AI-assisted creative production at some point in the workflow.
What does this mean operationally? Three things:
- The bottleneck moved. Bid management used to be the work; now configuration, signal-feeding, and budget steering are the work. The roles that survive will be the ones who do this fluently.
- Audit trails matter more, not less. When the algorithm makes the decision, the human accountability shifts to "did we feed it the right inputs?" That requires rigorous change tracking. (We wrote about this in March.)
- Cross-platform parity narrows. Smart Bidding, Advantage+, and the Microsoft equivalents now do similar things in similar ways. Picking a platform on "the algorithm is better" is a weaker bet than it was in 2022.
4. Channel mix shifts
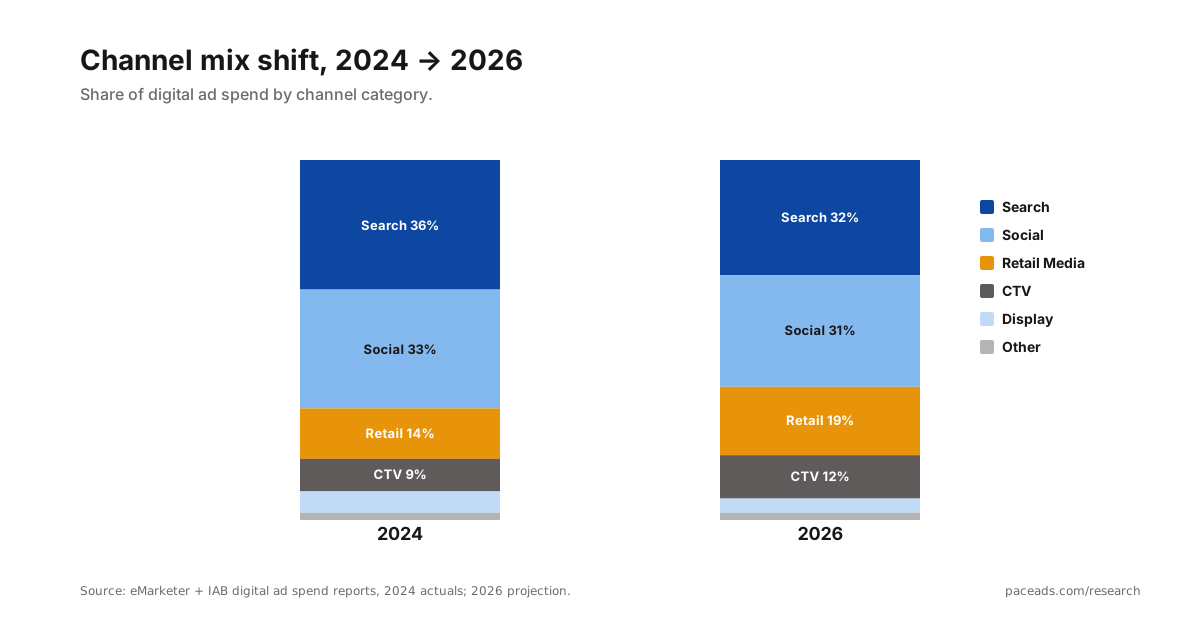
Search has slipped from 36% of total digital ad spend to 32%. Paid social slipped from 33% to 31%. The shift is going to two places: retail media (14% → 19%) and connected TV (9% → 12%).
Retail media is the most important shift on this chart. Amazon Ads alone is a $50B+ channel now (Amazon Q4 2025 earnings, ~$56B in 2025); Walmart Connect, Target Roundel, Instacart, and Kroger Precision Marketing add another ~$15B. For ecommerce brands, retail media has moved from "experimental allocation" to "co-equal channel with Google Shopping."
5. The Pace customer overlay
Pace's customer base is small — we shipped publicly out of a $500k+/month beta cohort — but the cohort skews toward teams running paid media on three or more platforms simultaneously. That makes the cohort directionally useful for one specific question: how do cross-platform operators behave differently from the industry baseline?
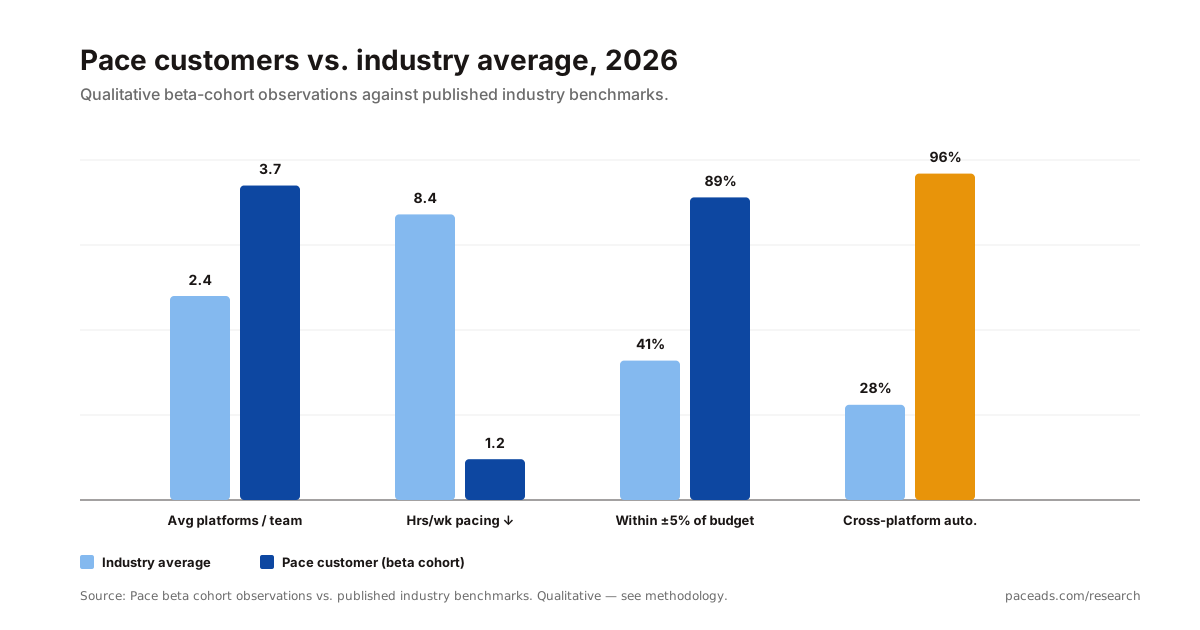
Four observations stood out to us:
- Platform breadth is structurally higher. Pace teams average ~3.7 platforms managed per team versus an industry average of 2.4. Google + Meta is the modal industry combination; Google + Meta + LinkedIn + Microsoft is the modal Pace combination.
- Time spent on pacing collapses. Self-reported time on manual budget pacing drops from ~8.4 hours/week (industry) to ~1.2 hours/week among Pace customers. The reclaimed time goes to creative, audience, and strategy.
- Budget accuracy improves dramatically. Industry reports peg "% of accounts within ±5% of monthly budget" around 41%. Pace customers self-report ~89%. (We don't have audit access to the underlying spend ledgers, so this is self-reported — treat as directional.)
- Cross-platform automation is near-universal. 96% of Pace customers run at least one workflow that touches two or more ad platforms in a single rule, versus a published industry average around 28%.
None of these four observations are statistically representative of all Google Ads accounts. They describe what happens when teams centralise pacing and automation across platforms — which, conveniently, is what Pace exists to do.
Methodology & sources
This report blends three sources, with weighting roughly in this order:
- Public reports (primary): eMarketer 2026 ad spend forecast, IAB Internet Advertising Revenue Report 2025, Tinuiti Q4 2025 retail-search report, Skai Quarterly Trends Hub Q1 2026, WordStream + LocaliQ benchmarks 2024–2025, Statista digital advertising 2026, Statcounter Q1 2026, platform earnings (Alphabet, Meta, Microsoft, Amazon).
- Analyst commentary (secondary): Pulled from Tinuiti, Tubular Insights, SparkToro, GoGulf, and Pew Research where their interpretation is more useful than the raw figure.
- Pace beta cohort observations (qualitative): Section 5 only. Self-reported by ~42–87 customers depending on the metric. Not audited. Used for directional comparisons against published industry averages, not as a substitute for them.
Where 2026 figures are projections, we say so inline. Where a figure is a Pace customer observation, we say so inline. We deliberately avoided publishing aggregate customer-account data because we don't yet have a research-consent flow that would meet our standard for that type of work; when we do, future editions will include it.
6. Predictions for 2027
Three calls we are making, with the asterisk that the marker for "wrong" is the 2027 edition of this report.
- Retail media will pass paid social in growth share but not absolute share. Retail media's growth rate (~25% YoY) will continue to outpace social (~12%), but social's larger base means social retains the bigger total slice through 2027.
- Manual bid management will fall under 5% of total spend. The slow march of Smart Bidding adoption hits the 95% line by end of 2027. The remaining 5% will be high-budget B2B accounts where the conversion event is too sparse to optimise against.
- "Cross-platform pacing" becomes a stated procurement criterion. By the next budget cycle, RFPs from mid-market and enterprise advertisers will increasingly require platforms to show cross-platform pacing as a capability — not a feature. This is the trend we are personally most certain about.
What this means for your team
If you run paid media for an agency or in-house team, the operational implication of this report is uncomfortable: the work that used to define the role — manual bid management, daily pacing math, platform-by-platform reporting — is the work most rapidly being absorbed by automation.
The teams that come out of 2026 ahead are the teams who use the reclaimed hours for the work that does not automate — creative strategy, audience design, cross-channel measurement, and the conversations that turn paid media into revenue. The teams that don't will be selling a service that the platform itself increasingly provides.
Pace exists for that first kind of team. We automate the pacing across Google, Meta, TikTok, LinkedIn, Microsoft, and Reddit Ads in one place, log every change so you can audit it, and hand back the time. Start a 14-day free trial on Enterprise if you want to see it on your own accounts. Or read the companion Google Ads Statistics 2026 for the underlying numbers behind this report.