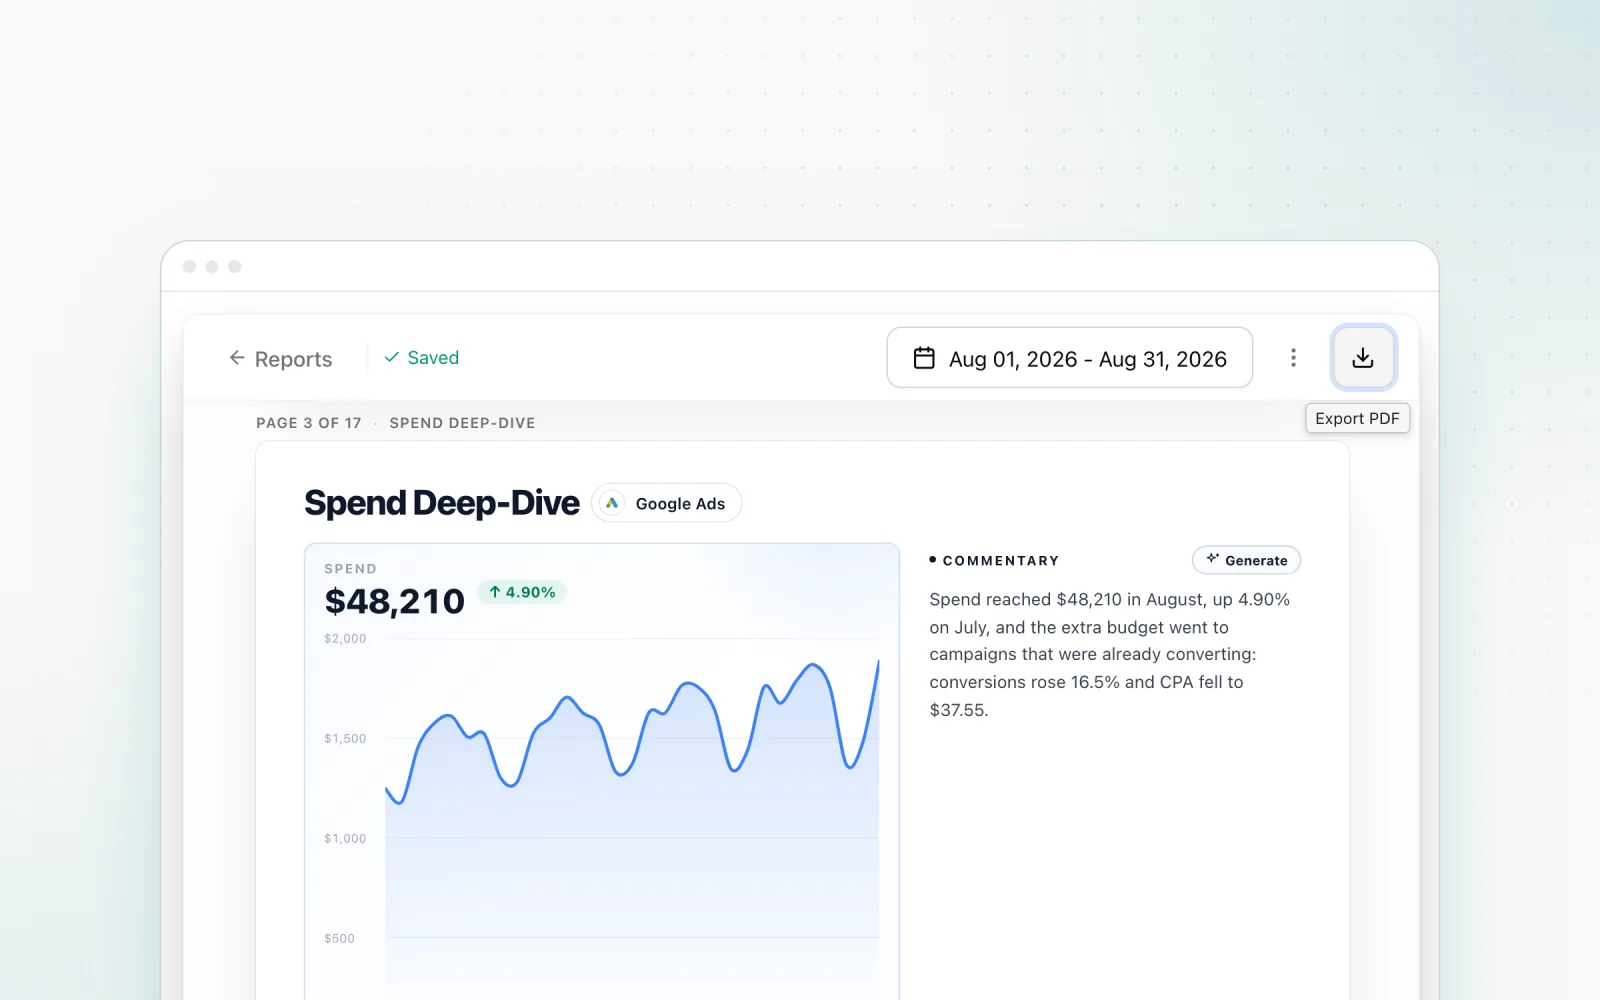
Every agency knows the feeling. You've run a strong month, hit your targets, driven real results. The client report does not tell that story. It's three platforms' worth of disjointed screenshots, CSVs pasted into slides, and hours of formatting that should have gone into strategy. PPC reporting software exists to fix exactly this.
I've spent years building reports across Google Ads, Meta, LinkedIn, and Microsoft Ads for agency clients, and I've tested most of the tools that claim to solve it. Some genuinely deliver. Some overpromise badly. Here's an honest assessment of what works, what the free options actually give you, and how to build dashboards clients will care about.
What Makes a Good PPC Reporting Tool?
Before comparing specific platforms, it helps to define what separates a real reporting tool from a glorified data export. (If you want a refresher on which metrics belong in a paid search report in the first place, our guide to paid search reporting metrics and best practices is the place to start.) The best PPC reporting software has six capabilities agencies actually need:
Cross-platform data aggregation. Most agencies run campaigns across Google Ads, Meta, LinkedIn, and Microsoft Ads at the same time. A tool that only pulls from one source forces you to maintain parallel reports or stitch data by hand. Unifying those feeds into one view is the whole point.
White-label customisation. Client-facing reports need your agency's branding, not the vendor's logo. Strong platforms let you customise logos, colour schemes, report URLs, and even email domains for automated delivery. Non-negotiable if reporting is part of how you sell yourself.
Automated scheduling. Generating reports by hand every week or month is a tax that scales linearly with your client count. Schedule weekly snapshots, monthly strategic reviews, or live dashboard access, and the recurring overhead disappears.
Custom KPI selection. An e-commerce brand wants ROAS and revenue. A B2B SaaS company wants cost per lead and pipeline contribution. A good dashboard lets you configure which KPIs sit at the top of each client's view rather than shipping a one-size-fits-all template.
Interactive dashboards. Static PDFs still have their place for execs. Interactive dashboards let clients filter by date range, drill into campaign-level details, and answer their own questions without waiting on you. The best tools offer both.
API integrations for custom data sources. Mature agencies need to pull in CRM data, offline conversions, and custom attribution alongside platform data. API access or connector support makes this possible without manual entry.
The Best PPC Reporting Tools Compared
Ten platforms worth considering in 2026, with the honest version of each. Pricing notes reflect what vendors publish in mid-2026; several use custom or demo-only pricing, and I have flagged those where I cannot quote a public number.
1. Looker Studio (Google)
Looker Studio is still the most capable free reporting tool available. The native integration with Google Ads, Google Analytics, and BigQuery is genuinely good, and the dashboard builder is flexible enough to put together polished client reports. For agencies with Google-heavy clients, the combination of zero cost and deep Google data access is hard to beat.
The catch is everything outside that ecosystem. Pulling Meta, LinkedIn, or Microsoft Ads data into Looker Studio means a third-party connector like Supermetrics, which adds cost and maintenance. If you manage campaigns across multiple platforms, Looker Studio alone won't get you to a unified report. The core product remains free in 2026; Looker Studio Pro adds team management and SLAs at roughly $9 per user per month. Best for budget-conscious agencies whose clients run mostly on Google.
2. AgencyAnalytics
AgencyAnalytics is purpose-built for agencies and it shows. Over 80 integrations covering every major ad platform, SEO tools, social, call tracking. White-labelling is thorough: custom domains, branded login portals, fully styled report templates. Scheduled email delivery works reliably out of the box.
Pricing in 2026 starts at $79 per month for the Launch plan (5 client campaigns) and scales to $239 per month for Grow (15 clients), with per-client add-ons after that. For mid-market agencies running 15 to 50 clients, this is one of the strongest options on the market. Dashboards are interactive, the report builder is friendly to non-technical team members, and onboarding takes hours, not weeks.
3. Supermetrics
Supermetrics is not really a dashboard tool. It's a data connector, middleware that pipes ad platform data into Google Sheets, Looker Studio, BigQuery, or Excel. If you already have a reporting workflow in Sheets or Looker Studio and just need reliable feeds from Meta, LinkedIn, and Microsoft Ads, Supermetrics is the bridge.
Pricing in 2026 starts at $39 per month for the Sheets-only Essentials plan and climbs to $199 per month for the Core plan that adds Looker Studio and Excel. The trade-off: you're still on the hook for building and maintaining the actual dashboards. It solves the data access problem, not the design problem. Good if you want full control over your report structure. Less good if you want something turnkey.
4. Swydo
Swydo focuses on automated PPC reporting, with a heavy emphasis on scheduled delivery and white-label presentation. The template library covers the common formats, and the drag-and-drop editor makes per-client customisation simple. Integrations span Google Ads, Meta, LinkedIn, Microsoft Ads, and several other marketing platforms.
Scheduled reporting is where Swydo earns its keep. You configure the report once, set the cadence, and the tool handles generation and distribution. Pricing in 2026 starts at $39 per month for 10 data sources, with each extra source adding around $3 per month. If your main pain point is the monthly production cycle, Swydo solves it without the weight of a full BI platform.
5. DashThis
DashThis sells itself as the simplest dashboard for agencies, and that's accurate. Drag-and-drop builder, no technical knowledge required, presets that cover most standard reporting needs, and over 30 integrations that connect quickly. The learning curve is short.
That simplicity is both the strength and the ceiling. It works well for agencies that want clean, professional dashboards without investing days in setup. If you need complex calculated metrics, advanced data blending, or highly bespoke visualisations, you'll outgrow it. Pricing in 2026 starts at $42 per month for 3 dashboards on the Individual plan and scales to $349 per month for 25 dashboards on the Business plan.
6. Optmyzr
Optmyzr is primarily a PPC optimisation and automation tool, but its reporting has come a long way. The reporting advantage is context: because the platform also handles bid management, budget pacing, and rule-based automation, the reports can surface optimisation insights alongside performance data.
If you already use Optmyzr for campaign management, adding its reporting saves you a second subscription. The reports include change history and optimisation actions, so clients see what your team is doing beyond the headline numbers. Pricing in 2026 starts at $279 per month for the Pro plan, scaling with spend under management. Adopting Optmyzr just for reporting would be overengineered, though.
7. NinjaCat
NinjaCat is the agency reporting platform that absorbed Shape.io in 2022 and rebuilt the data layer around a single pipeline for ads, SEO, social, and call tracking. The dashboards are polished, the white-label is thorough (custom domains, client portals, branded PDFs), and the data warehouse access is useful if your agency wants to layer BI tools on top.
NinjaCat does not publish pricing publicly. Quotes I've seen recently start around $500 per month for smaller agencies and climb into the low thousands for shops running 50+ clients. It is overbuilt for a solo freelancer and right-sized for an agency that wants one reporting stack across paid, organic, and call data without stitching three tools together.
8. Whatagraph
Whatagraph leans hard into visual reporting. The interface is the most designed of any tool on this list, and the report PDFs land in client inboxes looking like a slide deck rather than a data dump. Cross-channel data blending is a real feature, not just stacked charts, and the template library covers most agency use cases out of the gate.
Pricing in 2026 starts at $223 per month for the Professional plan (25 data sources) and $335 per month for Premium (50 sources). The platform is strong for agencies that pitch design and presentation as part of their differentiator, less compelling if you only need internal-facing dashboards where polish does not earn revenue.
9. TapClicks
TapClicks is the closest thing on this list to an enterprise BI platform built for agencies. The integrations library is the broadest I've seen (250+ data sources covering ads, SEO, social, email, CRM, and call tracking), and the order management and workflow features make it viable as an operating system for larger shops, not just a reporting layer.
Pricing is custom and demo-led. Plans typically start in the low hundreds per month for the basic dashboard tier and climb into four figures for the full marketing operations suite. Worth a look if you are already feeling the limits of point-solution reporting tools and want one platform to consolidate the stack.
10. Pace Ads
Pace approaches reporting differently. Instead of traditional dashboards full of charts and KPI widgets, Pace generates cross-platform change reports that document every automated budget adjustment alongside the reasoning behind it. Each report is both a performance summary and an audit trail.
That model is most useful for agencies that need to show active management to clients. Instead of "here's what happened", you get "here's what we did and why". The cross-platform pacing view shows spend progress across Google, Meta, TikTok, LinkedIn, Microsoft, Reddit, X Ads, and Amazon Ads in one interface, so you can assess multi-channel performance without flicking between dashboards. Pace is available with a 14-day free trial that includes every Enterprise feature; you're billed for the plan you picked at signup (published pricing from $49/mo) after that. Start a free trial to get started.
What Makes a Top Rated PPC Dashboard for Agencies?
"Top rated" gets used loosely. The dashboards agencies actually keep using past month three share four traits, and they are the ones worth filtering on when you shortlist.
Data freshness measured in minutes, not hours. The gap between "the platform updated overnight" and "the platform updated in the last 15 minutes" decides whether your account manager can answer a client's mid-day question without saying "let me check and get back to you". Looker Studio with Supermetrics typically refreshes every few hours on standard plans. AgencyAnalytics, NinjaCat, and Pace pull closer to real time. If your clients message you on Slack about spend, freshness is not optional.
White-label that holds up under scrutiny. A logo upload and a colour picker is the minimum. The dashboards clients trust are the ones that live on your domain, send from your email, and never surface a vendor's branding in the URL, the footer, or the export. AgencyAnalytics, NinjaCat, Whatagraph, and TapClicks all do this well. Looker Studio can be styled to look custom but cannot truly white-label the URL without a wrapper.
Client portal options, not just shared links. A real portal lets each client log in to their own view, see only their data, and access historical reports without you re-sending links. AgencyAnalytics and NinjaCat have native client portals. Several other tools (DashThis, Swydo) get you most of the way with shareable URLs but stop short of a true gated portal.
Automation that goes beyond scheduling emails. Top rated dashboards in 2026 trigger alerts on threshold breaches, regenerate sections when underlying data changes, and surface change logs without an account manager pasting them in. The bar has moved past "send the PDF on the first of the month". If a dashboard cannot tell a client what changed and why, it's a static report dressed up as a dashboard.
Use those four traits as the filter. If a vendor cannot demonstrate three of the four on a sales call, the rating is marketing, not product.
Free PPC Reporting Tools
Not every agency needs (or can yet justify) a paid reporting subscription. Here are the free options worth a look.
Looker Studio is the most capable free option by a wide margin. For Google Ads reporting, it's genuinely excellent. Dashboard builder, sharing, and integration depth rival a lot of paid tools. The catch: connecting non-Google data needs paid connectors.
Google Ads built-in reports give you basic dashboards and scheduled email exports directly inside the platform. Functional for single-platform reporting, but Google-only. You can't blend in Meta, LinkedIn, or Microsoft Ads performance, and customisation is thin compared to dedicated tools.
Native exports from Meta, LinkedIn, and Microsoft Ads are the unglamorous fallback. Each platform lets you schedule CSV or XLSX exports to email on a cadence you choose. The data is current and the price is zero. The cost is the manual work of stitching four exports into one client-ready report every month.
Free tiers from paid platforms exist for tools like AgencyAnalytics and DashThis, but they're deliberately limited, usually one or two clients with stripped-back features. They're fine for evaluating the platform before you commit. They're not a long-term solution.
Google Sheets with a Supermetrics free trial can cover one-off reporting needs. The 14-day trial gives you connector access, and Sheets is flexible enough to structure reports however you like. Practical for freelancers or agencies with a single client who need a quick fix.
Free vs Paid PPC Reporting: When the Maths Changes
The honest framing is not "free vs paid". It is "how many hours per month does building reports cost you, and at what point does that cross the subscription price of a paid tool?" Run the comparison across the four most common stacks and the break-even shows up clearly.
Free stack: Looker Studio + native platform exports. Total cost: $0. Suits agencies with one to three clients, mostly on Google Ads. Build time per client per month: 2 to 4 hours for a clean, white-labelled report. Past three clients, the maintenance work on connectors and template drift starts to compound.
Hybrid stack: Looker Studio + Supermetrics. Total cost: $39 to $199 per month depending on plan. Suits agencies with three to ten clients who want one dashboard tool but need Meta, LinkedIn, and Microsoft Ads data alongside Google. Build time drops to roughly 1 hour per client per month once templates are set. The break-even against pure free usually lands at four to five clients.
Paid agency stack: AgencyAnalytics or DashThis. Total cost: $79 to $349 per month for plans that cover 5 to 25 clients. Suits agencies with ten or more clients where white-label, client portals, and templated automation matter as much as the data itself. Build time per client drops to 15 to 30 minutes once onboarding is done. The break-even against the hybrid stack lands around ten clients, sometimes earlier if your hourly rate is high.
Enterprise stack: NinjaCat, TapClicks, or Whatagraph Premium. Total cost: $500+ per month, often custom. Suits agencies with 30+ clients running paid, organic, and call tracking who want one platform across the board. Build time per client drops to near-zero once the data sources are wired in. The break-even against the paid agency stack is usually a workflow decision rather than a maths one: you switch when juggling three point solutions starts costing more than one consolidated platform.
The rule of thumb that holds up: free reporting tools work for one to five clients, hybrid stacks for five to ten, paid agency tools for ten to thirty, and enterprise platforms above that. The break-even comes faster than most agencies expect because the hidden cost is not the build time, it's the context switching between platforms that erodes strategic hours.
Building a PPC Reporting Dashboard
Whichever tool you pick, the structure of your dashboard matters as much as the platform behind it. A well-built dashboard answers the client's questions before they ask them.
Executive summary. Lead with three bullets at the top: what happened this month, whether targets were met, what's planned next. Most clients will read this section and nothing else. Make it count.
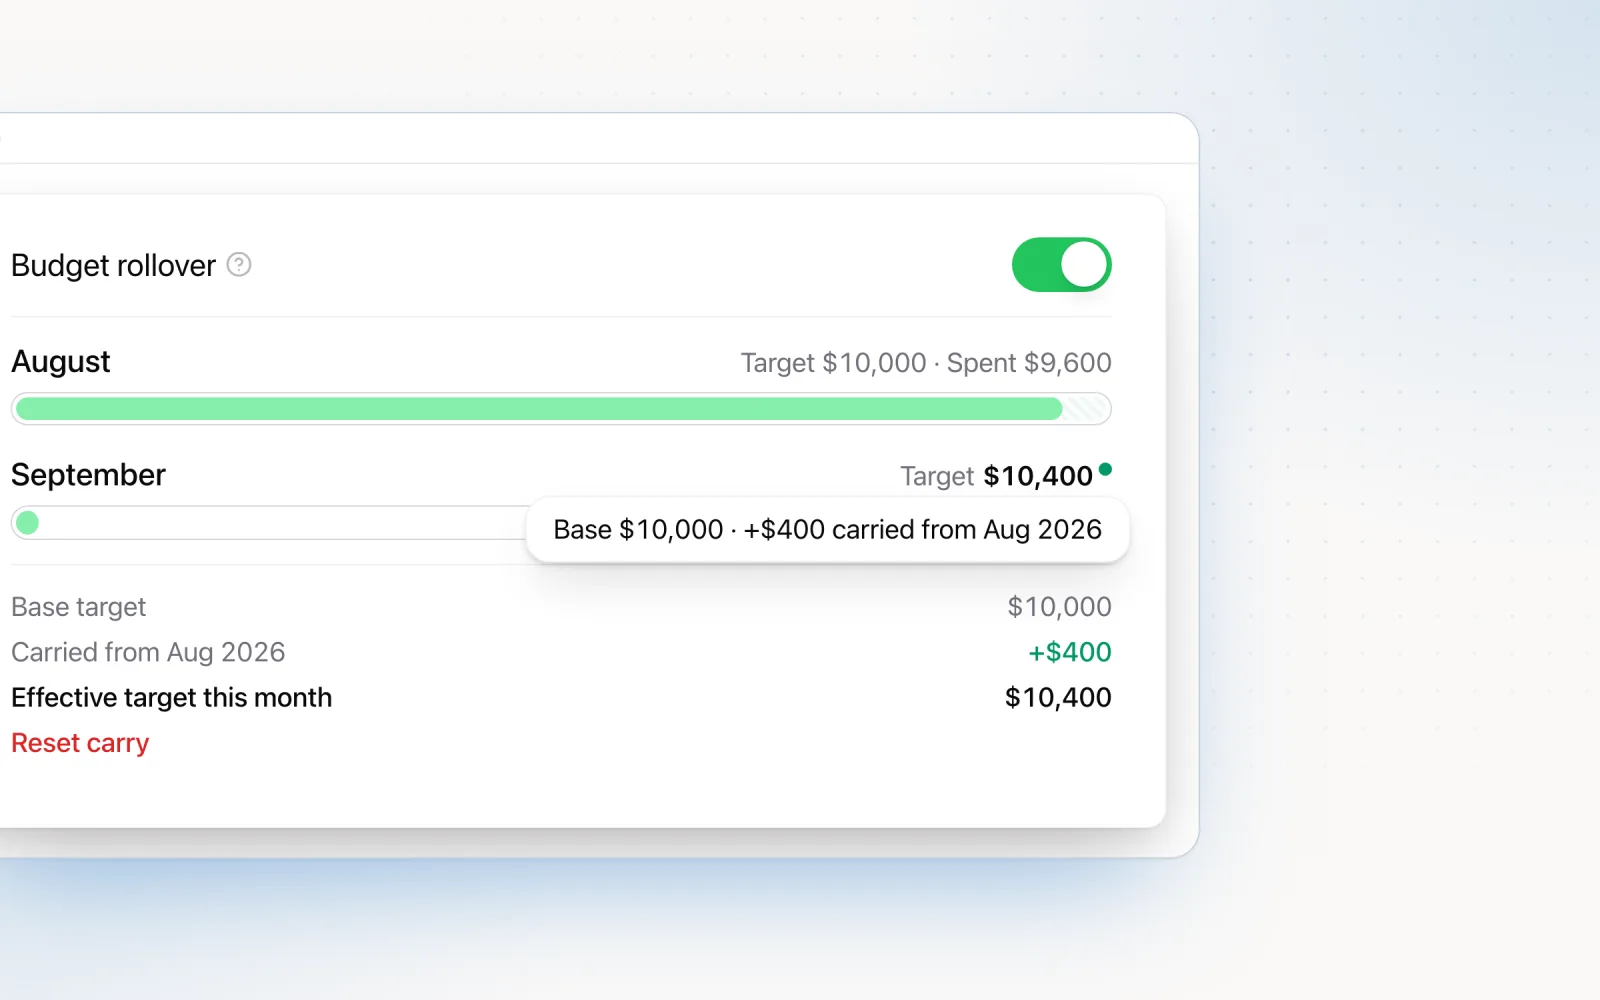
Spend versus budget pacing visual. A simple bar or gauge chart showing actual spend against the monthly budget target. It answers the most common client question on sight: are we on track?
Primary KPIs with trend lines. Surface the metrics that matter for each client (CPA, ROAS, conversion volume) with month-over-month or week-over-week trend lines. Trends beat single data points because they show direction, not just position.
Campaign-level breakdown table. A sortable table by campaign. This is how clients and account managers see which campaigns are driving results and which need attention. Spend, conversions, CPA, and ROAS as standard columns.
Search term insights. For search campaigns, include the top-performing search terms alongside the wasted-spend terms. It shows you're managing the account at a granular level, not just setting budgets and walking away.
Change log section. The most underrated component of a PPC report. Documenting what changed, when, and why turns a passive data report into a management record. Clients see the work your team is actually doing, and it builds trust that no chart can replicate. More on this in why your PPC reports should include a change log.
Use consistent colour coding across all sections. Lead with outcomes (conversions, revenue, leads) over inputs like impressions and clicks. Clients care about business results first. Supporting metrics provide context, but they shouldn't dominate the report.
PPC Reporting Best Practices for Agencies
The tools handle data collection and visualisation. How you use them is what decides whether reports build client relationships or get ignored as inbox attachments.
Match cadence to purpose. Monthly reports are for strategic review: what worked, what didn't, what's next. Weekly reports are for active periods where campaigns are being scaled, tested, or restructured. Wrong cadence for the situation (weekly noise during steady state, monthly-only during a launch) erodes the report's usefulness.
Lead with the narrative, not the data. Open every report with a written summary of what happened, why, and what comes next. Charts and tables are evidence for the narrative. If a client reads only the first paragraph, they should still understand the state of their account.
Include a change log. Document every significant optimisation, budget adjustment, and strategic decision made during the period. Show before-and-after impact where you can. No dashboard widget does more for client retention than this single addition.
Segment by campaign type. Don't average Search and Display together. Don't blend brand and non-brand. Don't smash prospecting and retargeting into one row. Each has different benchmarks and different jobs. Blending obscures performance and leads to bad decisions.
Always show pacing status. Clients want to know if the account is on track to hit its monthly target. A simple on-pace / ahead / behind indicator per platform gives them that on sight, and cuts the number of mid-month check-in requests.
Include next month's recommendations. End every report with a clear set of actions planned for the next period. It turns a backward-looking document into a forward-looking management tool, and gives clients a chance to weigh in before changes are made.
How Pace Handles Reporting
Pace approaches reporting differently because the problem it solves is different. Traditional reporting tools answer "what happened?" Pace answers "what did we do, and why?"
Instead of dashboards full of charts and KPI widgets, Pace generates change reports that log every automated budget adjustment with the reasoning behind it. When Pace bumps a campaign's daily budget because it's underpacing, the report captures the original budget, the new budget, the pacing calculation, and the expected outcome. You can share these directly with clients as proof of active management.
The cross-platform pacing view shows spend progress across Google, Meta, TikTok, LinkedIn, Microsoft, Reddit, X Ads, and Amazon Ads in one place. Instead of bouncing between eight platform dashboards, agencies see budget consumption, pacing status, and projected month-end landing for every account in a single view. For a deeper look at how this works without GA4 as a data layer, see cross-platform ad reporting without GA4.
The model works especially well for agencies that have had the "what are you actually doing for us?" conversation. Change reports with full audit trails make the answer visible and verifiable. Pair that with automated pacing adjustments and reporting flips from a time cost into a retention tool.
Pace is available with a 14-day free trial that includes every Enterprise feature. Start a free trial to get started.

Jordan Parrello
Founder of Pace. Ran an agency pacing sheet by hand for years before building the thing that checks it every 5 minutes. About Pace or LinkedIn