If you manage paid media for multiple clients, your reporting stack probably looks like this. GA4 for on-site analytics. Looker Studio for visualisation. Platform-native dashboards for real-time campaign checks. A spreadsheet for budget tracking. Maybe Supermetrics or Funnel piping data between everything.
Every layer shows slightly different numbers. GA4 attributes conversions differently to Google Ads. Meta uses a different conversion window to whatever ends up in Looker. LinkedIn has its own model again. The spreadsheet is always at least a day behind. And the Looker dashboard breaks every time someone renames a campaign.
This is not a technology problem. It's an architecture problem. Agencies have built reporting stacks that try to answer every possible question from one pipeline, and the result is a fragile system that answers none of them well.
Two Kinds of Reporting That Get Conflated
Agencies use the word "reporting" to describe two completely different activities, and that's where the mess starts.
Analytics reporting answers "How did the campaign perform?" Conversion attribution, user journeys, on-site behaviour, assisted conversions, ROAS against actual revenue. This needs website-level data, which is why GA4, Shopify, and CRM integrations matter for this layer. It tells you what users did after the click.
Management reporting answers a different question: "Are we on track?" Spend pacing, budget utilisation, cost efficiency trends, and (most importantly) what changed and why. Management reporting does not need website data. It needs ad platform data. How much was spent, where it went, what the platform-level metrics look like, and whether the current trajectory will land on target.
Most ad management tools try to do both. They integrate with GA4, pull from ad platforms, and layer everything into one dashboard. The result is a tool that is complicated to set up, fragile when data sources change, and slow because it is pulling from six APIs every time you open it.
Pace took a different route. We focus entirely on management reporting. That's a deliberate choice, not a missing feature.
Why Pace Skips GA4, Looker, and Shopify Integrations
When we designed Pace, the choice was simple. Build another data warehouse that aggregates everything, or build a management layer that does one job properly. We picked the second.
Pace does not integrate with GA4. It does not connect to Looker Studio. It does not pull data from Shopify, HubSpot, or your CRM. By design.
The reasoning is plain. Agencies already have analytics tools. They've spent months, sometimes years, configuring GA4 properties, building Looker dashboards, and training teams on them. Adding another tool that replicates that work creates duplication, not efficiency. You end up maintaining two versions of the same data, reconciling discrepancies, and explaining to clients why the numbers in one tool don't match the numbers in another.
Pace answers the questions analytics tools don't. Where is the money going right now? Are we going to hit the monthly target? What changed since yesterday? Who changed it? Was it the right call?
These are the questions that keep agency owners up at night. None of them need a GA4 property.
What Pace’s Reporting Layer Actually Includes
Pace connects directly to Google Ads, Meta, TikTok, LinkedIn, Microsoft, Reddit, X Ads, and Amazon Ads APIs. Four reporting layers come out of those connections, and together they cover what management reporting actually needs.
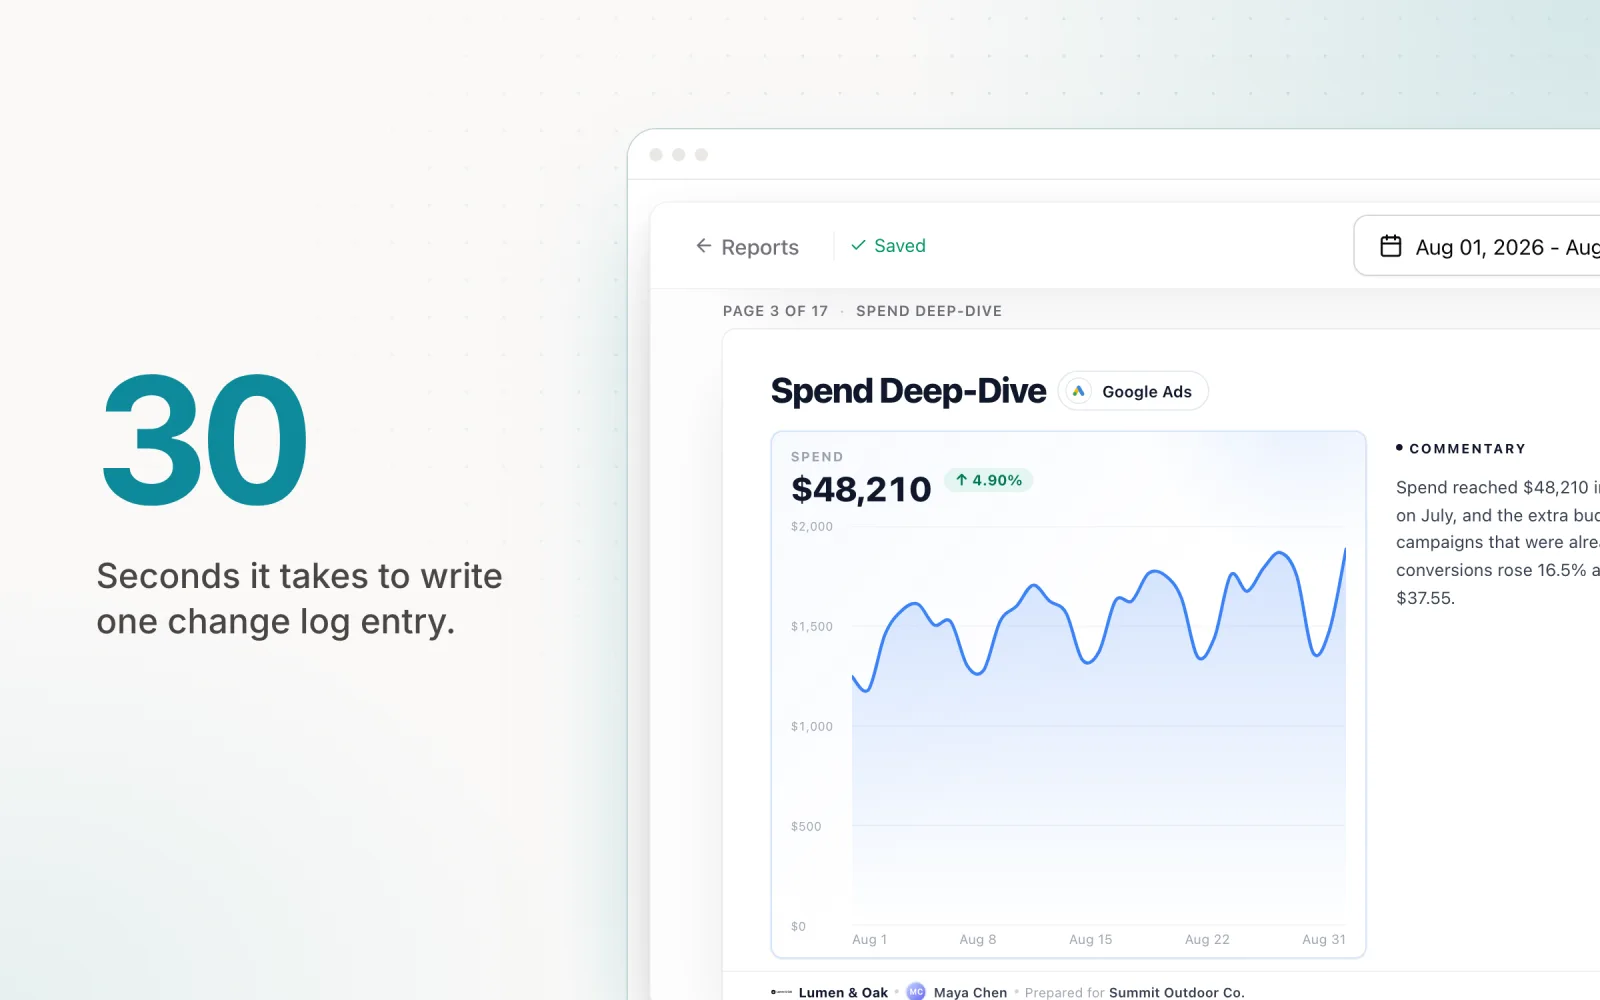
Cross-platform spend dashboards. Real-time spend from every connected platform in one view. Total spend, spend by platform, spend by client, spend by campaign, all without logging into a single ad platform. The data updates continuously through the day, not once when someone remembers to pull an export. For agencies managing campaigns across Google, Meta, and LinkedIn, this kills the daily platform-switching ritual that eats hours every week.
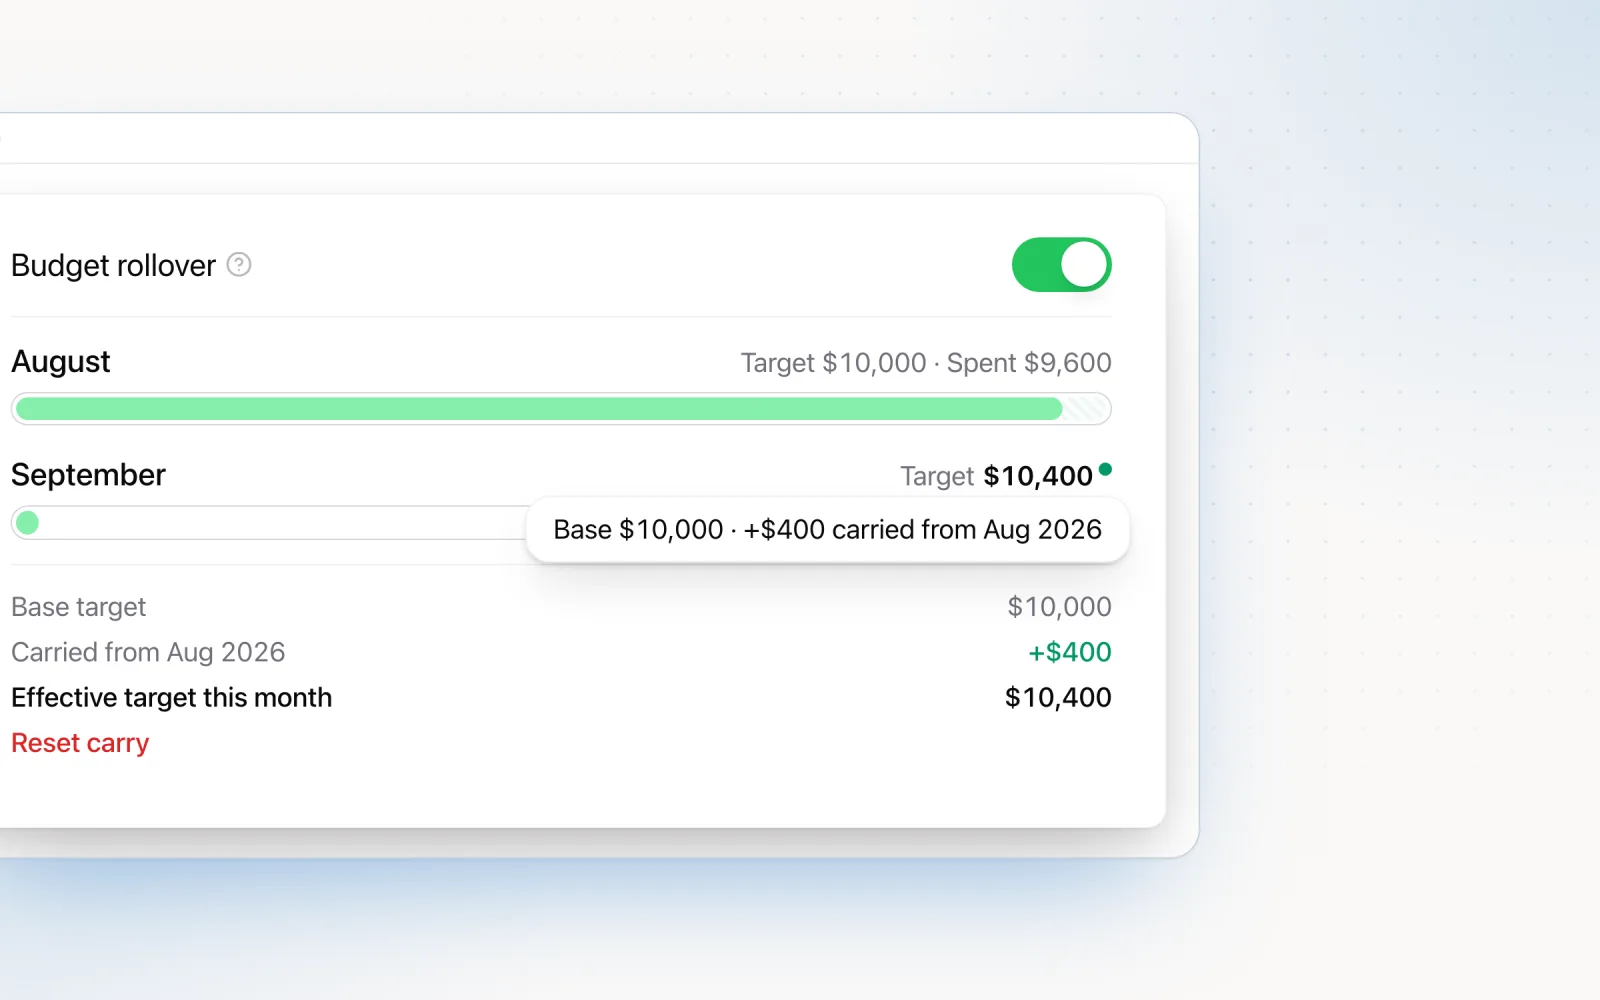
Budget pacing reports. This is where Pace looks least like a traditional reporting tool. Pacing reports show daily, weekly, and monthly budget accuracy. How much was spent against target, the projected end-of-month spend on current trajectory, and whether each account is tracking ahead or behind. When an account drifts past a defined threshold, Pace flags it. You don't have to calculate remaining budget divided by remaining days in a spreadsheet. The system does that for every account, in real time.
Performance snapshots. Pace pulls platform-level performance metrics straight from ad platform APIs. Impressions, clicks, conversions, CPA, ROAS, cost per conversion. These are the metrics each ad platform reports using its own attribution model. That distinction matters. Google Ads reports Google Ads conversions. Meta reports Meta conversions. None of those numbers need GA4 to exist. They come directly from each platform's own tracking, like Google Ads conversion tags, the Meta pixel, and the LinkedIn Insight Tag.
Multi-board dashboards. Different people need different views. An account manager wants portfolio roll-ups. A media buyer wants campaign-level detail. An agency owner wants portfolio trends. Pace supports multiple dashboard views configured for each, all reading from the same underlying data, so there's no need to maintain a separate Looker report per audience.
Change Reports: The Layer Most Tools Miss
Every reporting tool can show you performance data. Impressions, clicks, conversions, spend. Table stakes. What almost no tool shows you is what changed.
Pace's change reports log every budget adjustment, campaign status change, and optimisation action with a timestamp, the before and after values, the reasoning behind the change, and the expected impact. This isn't a vague activity feed. It's a structured audit trail that tells you exactly what happened to each account and why.
It matters for a few reasons.
Accountability is the obvious one. When a client asks why spend jumped 20% on Tuesday, you don't have to reconstruct the timeline from memory. The change report shows the adjustment, who made it, and the reasoning at the time. We've written about this at length. Including a change log in your PPC reports is one of the highest-leverage things an agency can do for client retention.
Then there's pattern recognition. Over time, change reports reveal patterns in how campaigns behave and how your team responds. You start to see which types of changes produce results and which don't. No analytics dashboard gives you that.
And client trust. When clients can see their agency made 35 documented optimisations last month, each with a clear rationale, the value of the relationship stops being abstract. You're not asking the client to trust that work is happening. The work is visible, timestamped, and explained.
Pairing Pace with Your Existing Analytics Stack
The question I hear most is, "If Pace doesn't integrate with GA4, how do we get the full picture?"
You already have the full picture. You just need to stop expecting one tool to provide it.
Pace handles management reporting. Where the money is going, whether you're on track, what changed. GA4 and Looker handle analytics reporting. What users did on-site after clicking, which channels contributed to conversions, how on-site behaviour varies by traffic source.
The two layers complement each other. They don't overlap. When a client asks "What did we spend this month and are we on budget?", you open Pace. When a client asks "What's the conversion rate from Meta traffic on our new landing page?", you open GA4. Trying to answer both from the same tool is how agencies end up with reporting stacks that take weeks to configure and break every time a data source changes.
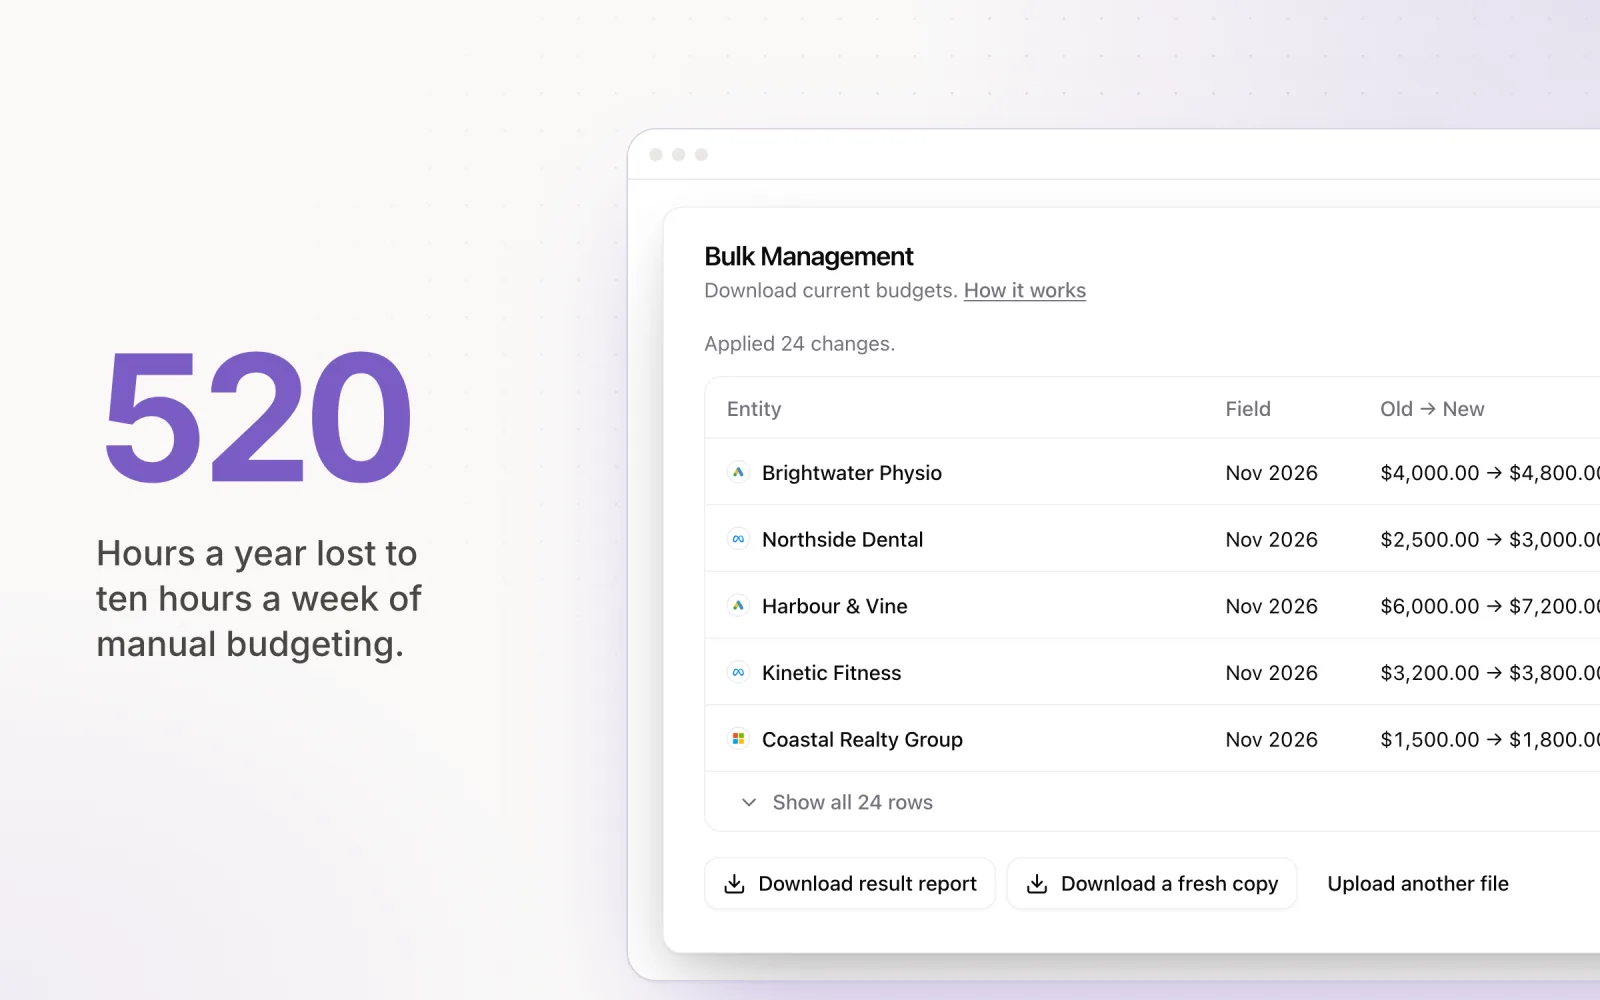
At 20+ clients, this separation isn't a nice-to-have. Maintaining a GA4 integration for every client inside every tool creates a matrix of connections that gets more fragile as the client count grows. The hours wasted on manual data reconciliation across those systems are hours that could be spent on strategy.
Conversion Tracking Without GA4
A common misconception is that without GA4, you can't see conversion data. Not true.
Google Ads, Meta, LinkedIn, and Microsoft all have their own conversion tracking. Google Ads uses its own conversion tags (or imports from Google Analytics, while still tracking independently). Meta uses the pixel and Conversions API. LinkedIn uses the Insight Tag with event-specific conversion tracking. Microsoft has its UET tag.
Pace pulls conversion data straight from those platform-native systems via their APIs. When you see conversion counts, CPA, or ROAS inside Pace, those numbers come from the ad platform itself. The same numbers you'd see if you logged into Google Ads or Meta Business Manager directly.
One nuance worth flagging. Platform-attributed conversions and GA4-attributed conversions are different numbers. Different attribution models, different lookback windows, different counting rules. Google Ads might report 50 conversions for a campaign while GA4 reports 35, simply because they define and count conversions differently.
For management reporting (pacing decisions, budget allocation, performance monitoring), platform-attributed conversions are the right dataset. They're the numbers you use to decide whether to push more or less budget into a campaign. They're the numbers each platform's bidding algorithm optimises against. And you can get them with zero GA4 configuration.
One limitation I'll be upfront about. Cross-platform deduplication is harder without a site-level analytics layer. If a user clicks a Google ad and a Meta ad before converting, both platforms may claim the conversion. Pace shows you what each platform reports. It does not deduplicate across platforms, because doing that accurately needs on-site tracking data Pace intentionally doesn't collect. For deduplication, GA4 or a dedicated attribution tool is still the right answer.
Predictive Analytics from Ad Platform Data Alone
One advantage of focusing on ad platform data is that the dataset is clean, consistent, and available near-real-time. Pace uses historical spend patterns and conversion trends to generate forward-looking projections.
The most useful one is end-of-month spend forecasting. Based on current daily spend, day-of-week patterns, and historical pacing data per account, Pace calculates where each account will land at month end. The projection updates continuously, getting more accurate as the month progresses.
Pace also uses historical performance data to flag trend shifts. If a campaign's CPA has been climbing for two weeks, the system flags it before it becomes a budget problem. If conversion volume drops below historical norms, you see it in the dashboard before it shows up in a monthly report.
This predictive layer runs entirely off ad platform API data. No BigQuery pipeline, no custom Looker models, no data warehouse. Predictions are generated from the same data that powers the spend dashboards and pacing reports, so they're always consistent with the numbers you see elsewhere in the system.
For agencies that do maintain a data warehouse for deeper analysis, Pace's predictions act as an early warning system. They catch the trends that matter for budget management days before those trends would surface in a weekly analytics review.
The Practical Upshot
Ad tech has spent years building tools that try to be everything. Analytics platform, reporting tool, budget manager, data warehouse. The result is expensive, complex platforms that need dedicated analysts to configure and maintain.
Pace goes the other way. We do management reporting. We do it well. We don't pretend to replace your analytics stack, and we don't ask you to maintain another set of GA4 connections for another tool.
If your days are switching between platform dashboards, updating pacing spreadsheets, and patching Looker reports that break every month, you already know the stack isn't working. The fix isn't more integrations. The fix is separating the questions you're trying to answer and using the right tool for each.
Pace answers the management questions. Your analytics stack answers the analytics questions. Together, they give you the full picture without the fragile, over-engineered pipeline in the middle.
If you want to see what management reporting looks like when it's built as its own layer, start a free Pace trial and we'll walk you through it.

Jordan Parrello
Founder of Pace. Ran an agency pacing sheet by hand for years before building the thing that checks it every 5 minutes. About Pace or LinkedIn