Every paid search campaign generates data. Impressions, clicks, conversions, costs. The numbers pile up fast across campaigns, ad groups, and keywords. Raw data is not a report. A paid search report takes that data, filters it through the lens of business objectives, and produces something a stakeholder can act on. The difference between a strong report and a weak one isn't how many metrics it has. It's whether someone can read it in five minutes and understand what happened, what it means, and what comes next.
After years of building paid search reports for agency clients and in-house teams, I've come to think the format matters as much as the content. The right metrics in the wrong structure get ignored. The wrong metrics presented beautifully still lead to bad decisions. This guide covers both: which paid search analytics metrics to track, and how to package them into reports people actually read.
What is paid search reporting?
Paid search reporting is collecting, organising, and presenting PPC campaign performance data for stakeholders. Those stakeholders might be clients, executives, team leads, or your own account managers reviewing last month's work. The purpose is the same in every case: communicate what happened, evaluate whether it met expectations, and guide the next set of decisions.
A paid search report is not a data export. Emailing a CSV from Google Ads to a client is not reporting. It's data transfer. Reporting requires interpretation. You select the metrics that matter to this audience, compare performance against targets, and explain the why behind the numbers.
The right cadence depends on the purpose. Weekly snapshots track spend pacing and flag any metric that has moved significantly. Keep these brief, ideally one page. Monthly deep dives analyse full-funnel performance with period-over-period comparisons, search term insights, and recommendations for the upcoming month. Quarterly strategy reviews step back further and assess whether the campaign structure, targeting, and budget allocation still align with business goals. Each cadence serves a different decision and should be structured to match.
Essential paid search analytics metrics
Not every metric deserves a spot in your paid search report. The metrics you include should answer the questions your audience is actually asking. Here are the ones that matter most, with context on what "good" looks like and where teams typically get it wrong.
Cost per acquisition (CPA). CPA measures how much you spend to generate one conversion. For lead generation campaigns, it's the single most important efficiency metric. What counts as a good CPA depends on the business. A SaaS company might target $50, a local services business $15. The common pitfall: averaging CPA across campaign types. Brand campaigns will always have a lower CPA than non-brand prospecting. Blending them produces a number that's technically accurate and practically meaningless. If you need to run the numbers per campaign quickly, our free CPA calculator handles the arithmetic.
Return on ad spend (ROAS). ROAS measures revenue generated per dollar of ad spend. A ROAS of 4:1 means every dollar spent returned four dollars in revenue. For e-commerce, it's the primary performance indicator. The pitfall: ignoring the attribution window. A ROAS of 8:1 on a 28-day click window looks very different from the same campaign measured on a 7-day window. Always note the attribution model and window in your report.
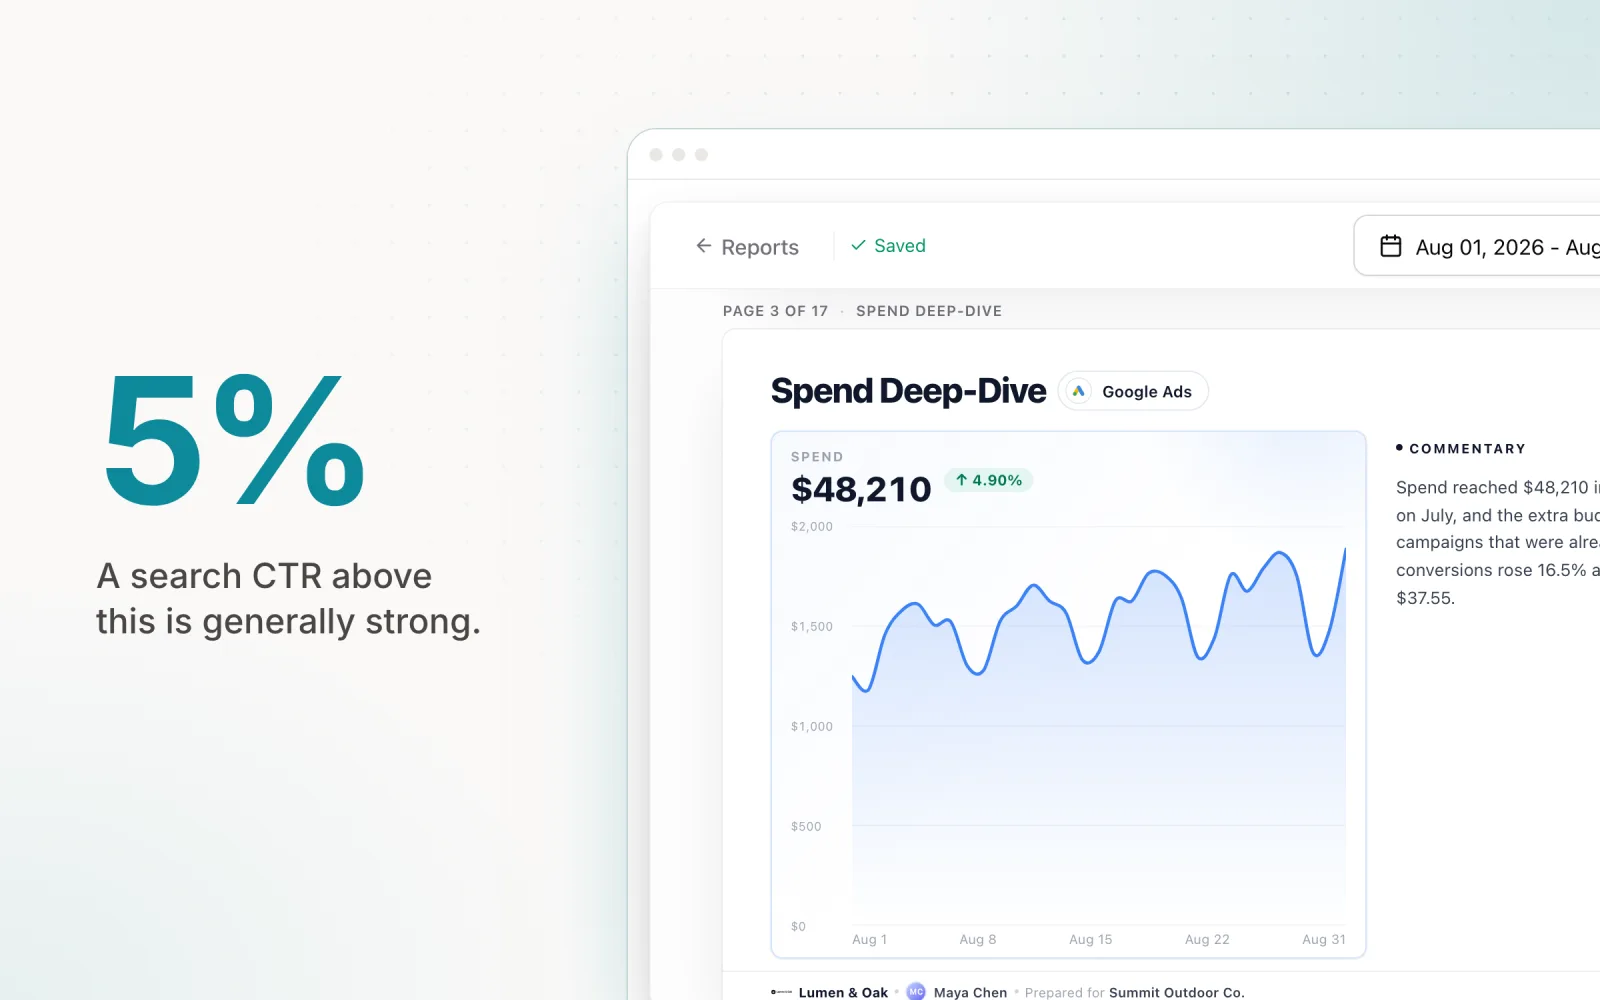
Click-through rate (CTR). CTR is the percentage of people who saw your ad and clicked. For search campaigns, anything above 5% is generally strong, though this varies a lot by industry and keyword intent. CTR matters because it directly influences Quality Score, which in turn affects your cost per click. The pitfall: treating low CTR as purely an ad copy problem. Sometimes it's targeting. If you're showing up for irrelevant queries, your CTR will suffer no matter how good the ad is.
Cost per click (CPC). CPC is the average cost of each click. It's useful for reading the competitive landscape and spotting trends in auction pressure. Rising CPCs with stable CTR usually mean more competition. Falling CPCs with falling CTR often mean you're winning cheaper, less relevant clicks. Always interpret CPC alongside conversion rate. A higher CPC that converts at twice the rate may actually be the more efficient one.
Conversion rate. The percentage of clicks that result in a conversion. For paid search, strong conversion rates typically fall between 3% and 8%, though high-intent keywords can convert at 15% or more. Conversion rate is often a landing page problem as much as a campaign problem. If CPC is reasonable and CTR is strong but conversion rate is poor, the issue is downstream of the click.
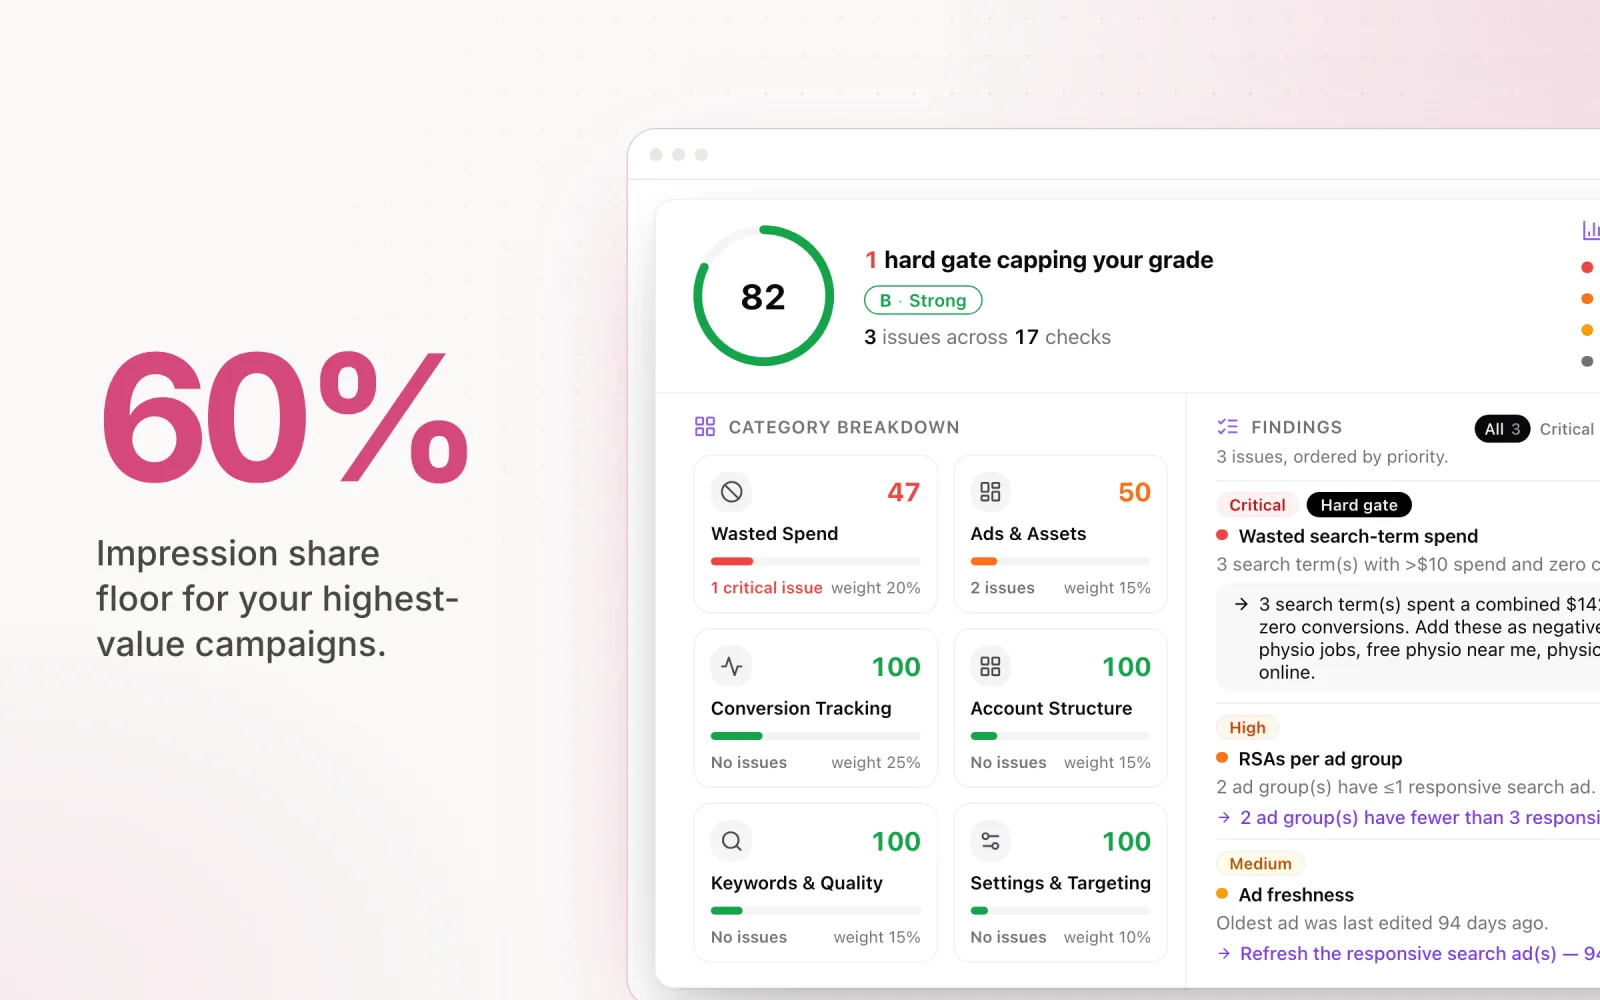
Impression share. The percentage of eligible impressions your ads actually received. At 60% impression share, you're missing 40% of available demand. This metric tells you about growth potential. An account with strong CPA, high conversion rate, and 45% impression share has serious room to scale. The same metrics at 95% impression share means you're close to the ceiling. Report search impression share alongside impression share lost to budget and impression share lost to rank to diagnose where the gap is coming from.
Quality Score. Google's 1-10 rating of your keyword relevance, based on expected CTR, ad relevance, and landing page experience. It directly affects your CPC and ad position. A Quality Score of 7 or above is strong. Below 5 means something is misaligned in the keyword-ad-landing page chain. The pitfall: obsessing over Quality Score on every keyword. Focus on high-volume, high-spend keywords where improvements actually move the cost needle.
Budget utilisation. How much of the allocated budget was actually spent. Consistent underspend means your campaigns can't find enough qualifying traffic at your bid levels. Overspend means platform daily budget controls aren't holding. Both need attention, and both should be visible in every report. Stakeholders care about this more than most PPC managers realise. It's often the first thing a client or executive looks for.
Structuring a paid search report
A well-structured paid search report answers questions in the order stakeholders ask them. Headline first, supporting evidence next, plan at the end. Structure to match.
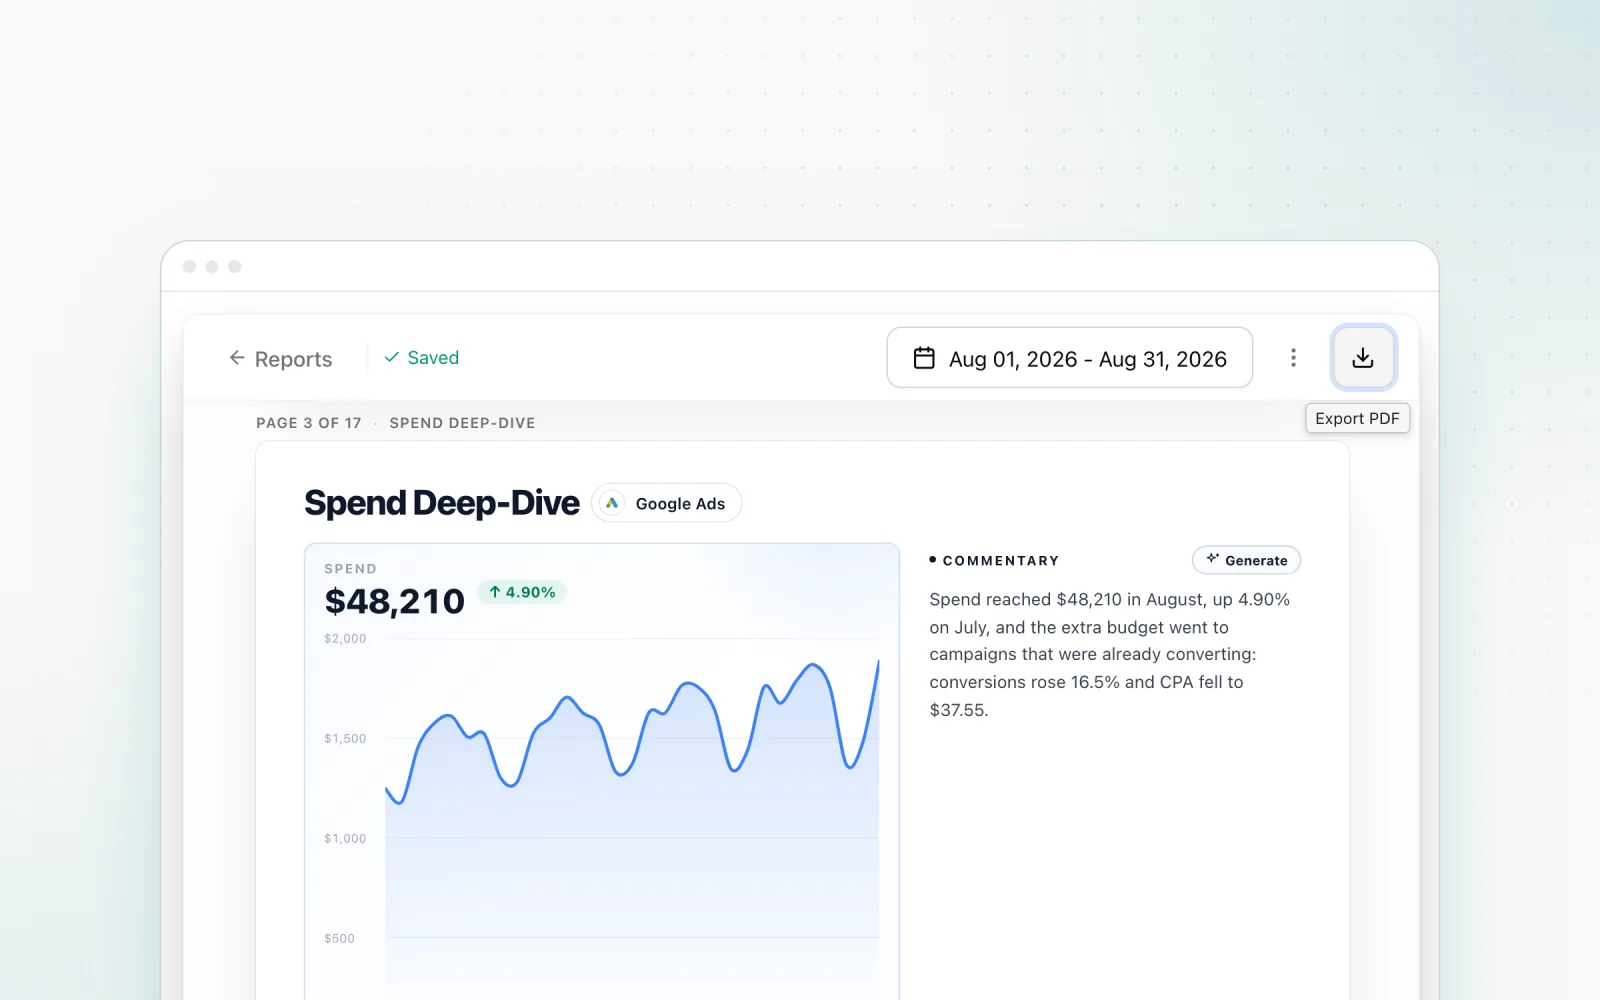
Executive summary. Three to five KPIs compared against their targets. Was the month on track? Did conversions increase? Did CPA hold? Readable in 30 seconds. If a stakeholder reads nothing else, this should give them what they need.
Budget pacing section. Actual spend against the monthly budget target with a clear visual: a progress bar, gauge, or simple table. Include daily run rate and projected month-end spend. For multi-platform accounts, break this out per platform. Pacing status (on track, over, under) should be obvious at a glance. Our free ad budget pacing calculator does the projected month-end math for you if you want to sanity-check a single account, and for a deeper look at pacing frameworks, see our guide on landing your ad spend exactly on target.
Campaign-level breakdown. A sortable table showing performance by campaign. Spend, conversions, CPA (or ROAS for e-commerce), CTR, and impression share as standard columns. Never blend brand and non-brand campaigns into a single average. Never combine Search and Display. Each campaign type has different benchmarks and serves a different purpose.
Search term insights. Surface the top-performing search terms that drove conversions, alongside the wasted-spend terms that ate budget without converting. This section demonstrates active account management at the granular level. It's also genuinely useful intelligence for the business. The search terms people actually use often look very different from the keywords the team expected.
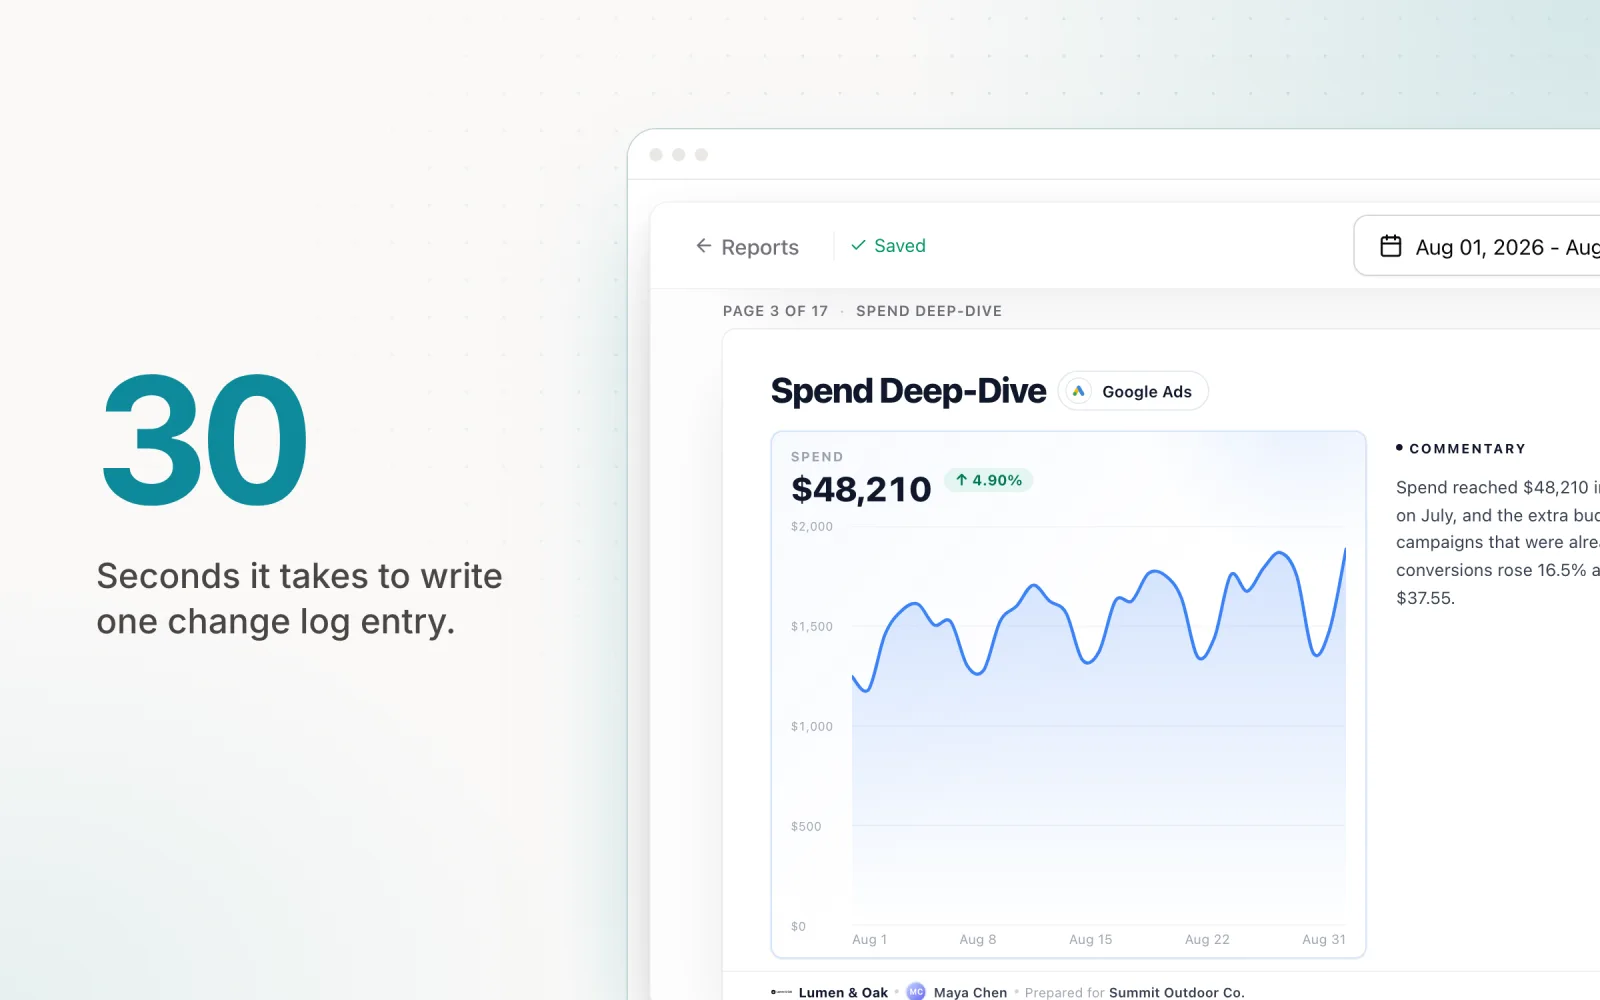
Change log. Document what was adjusted during the reporting period and why. Budget changes, bid adjustments, new negative keywords, paused campaigns, ad copy tests. Every significant action recorded with the rationale. This is the most underrated component of a paid search report. It turns a passive data summary into an active management record, which is what builds client trust. For more, read why your PPC reports should include a change log.
Recommendations for next period. End with a clear set of planned actions. Campaigns to scale, tests to launch, budgets to adjust, targeting changes to implement. The report stops being backward-looking and becomes a plan stakeholders can react to before changes are made.
Paid search reporting tools
The tool you use determines how much of your time goes into building reports versus actually analysing the data inside them. Here's an honest read on the main options.
Google Ads built-in reports. Functional for single-platform reporting. You can build custom dashboards, schedule automated email exports, and save reports. The limitation is obvious: it only covers Google. If you're running campaigns across Meta, LinkedIn, or Microsoft Ads, built-in reports only tell part of the story. For Google-only accounts, they're a reasonable starting point.
Looker Studio. Google's free dashboarding tool is the most capable free option. Native integration with Google Ads is solid, and visualisation options are flexible enough for polished client-facing reports. The catch: connecting non-Google data sources requires paid connectors like Supermetrics. For agencies running multi-platform campaigns, Looker Studio alone won't produce unified reports without additional spend on data connectors.
AgencyAnalytics and Supermetrics. Both are established paid reporting platforms built for agencies. AgencyAnalytics (see our full AgencyAnalytics review) is a turnkey solution with 80+ integrations, white-label branding, and automated report delivery. Supermetrics is middleware that pipes data from ad platforms into Sheets, Looker Studio, or BigQuery. You still build the report yourself, but the data access problem is solved. Both add cost and save real time once you pass five to ten clients.
Pace. Pace takes a different angle. Instead of conventional dashboards with charts and KPI widgets, Pace generates cross-platform change reports that document every budget adjustment alongside the reasoning behind it. The pacing view shows spend progress across Google, Meta, TikTok, LinkedIn, and Microsoft Ads in one interface. This works particularly well for teams that need to demonstrate active management (what was done, when, why) rather than only what happened. For a deeper comparison, see our full guide on the best PPC reporting tools for agencies.
Building a paid search report template
A good template saves time without sacrificing quality. Here's a step-by-step approach to one that scales across clients and campaigns.
Step 1: Define KPIs per client. Before opening any reporting tool, pick the three to five metrics that matter most for each client or stakeholder. An e-commerce brand cares about ROAS and revenue. A B2B SaaS company cares about cost per lead and SQL volume. A brand awareness campaign cares about impression share and reach. Trying to include every metric in every report produces a document that serves nobody well.
Step 2: Set up data sources. Connect every platform your campaigns run on. For multi-platform accounts, make sure data refresh is on the same schedule across platforms so the reporting period actually matches. Mismatched freshness (Google showing yesterday, Meta showing two days ago) quietly destroys the report's credibility.
Step 3: Build the layout. Follow the structure above. Executive summary at the top. Budget pacing next. Campaign-level breakdown in the middle. Search term insights and change log below. Recommendations at the bottom. Use consistent colour coding. Lead with outcomes (conversions, revenue, leads), not inputs (impressions, clicks).
Step 4: Add visualisations. Trend lines beat single data points. A CPA of $42 means nothing without context. Was it $38 last month? Has it been climbing for three months? Use line charts for metrics over time, bar charts for campaign-level comparisons, and simple tables for detailed breakdowns. Avoid pie charts for anything other than budget allocation splits. They're notoriously hard to read past four segments.
Step 5: Automate delivery. Set the report to generate and distribute automatically on the right cadence. Weekly snapshots should arrive Monday morning. Monthly deep dives should land within the first three business days of the new month. Automated delivery keeps things consistent, but review the report manually before it ships. Automated does not mean unsupervised. A report with an anomaly you haven't explained creates more questions than it answers.
Tips for stronger templates. Include a "key takeaways" section at the top that changes every period. It forces you to interpret the data instead of just presenting it. Annotate charts when something significant happened: a budget increase, a campaign launch, a landing page test. Use period-over-period comparisons (month-over-month or week-over-week) rather than absolute values alone. Keep the whole report under ten pages. Past that, the stakeholder won't read it.
Client reporting best practices
The mechanics of building a report are straightforward. What separates one that gets read from one that gets archived unread is how the information is presented and positioned.
Lead with insights, not data dumps. Open every report with a written summary: what happened, why it happened, what the plan is. The charts and tables are supporting evidence for that narrative. If the first thing a stakeholder sees is a grid of numbers, they're already gone before reaching the part that matters. Write the opening paragraph as if you're briefing someone in person.
Tailor detail level to the audience. A CMO wants three bullet points and a trend line. An account manager wants campaign-level breakdowns with search term data. A media buyer wants keyword-level performance with bid recommendations. The same underlying data can serve all three, but the level of abstraction has to change. Build modular reports where the executive summary stands alone and the detailed sections are there for whoever wants to dig deeper.
Include a change log showing what you did and why. This single addition does more for client retention than any dashboard design. When a client can see you paused an underperforming campaign, reallocated budget to a top converter, added 23 negative keywords to cut waste, and tested two ad variants, all with reasoning attached, the "what are you actually doing for us?" conversation never happens.
Use period-over-period comparisons. Never present a metric in isolation. CPA was $38, compared to what? Show month-over-month and year-over-year where you have it. For most stakeholders, trend direction matters more than absolute values. A CPA of $38 that was $45 last month tells a completely different story from a CPA of $38 that was $32 last month.
Keep it under ten pages. Every page beyond ten reduces the chance the full report gets read. If you need more than ten pages, the report likely has data that belongs in an appendix, not the main body. Edit ruthlessly. Ask whether each section drives a decision or just occupies space.
Automate delivery but review manually. Set up automated generation and distribution, but review the report before it reaches the stakeholder every time. Automated reports that surface an unexpected spike or drop without context create more problems than they solve. Ten minutes of review per report, with a sentence of context where it's needed, costs almost nothing compared to the trust it protects.
Frequently asked questions
What should a paid search report include?
A paid search report should include an executive summary with three to five KPIs compared against targets, a budget pacing section showing spend versus plan, a campaign-level performance breakdown, search term insights highlighting top performers and wasted spend, a change log documenting what was adjusted and why, and clear recommendations for the next reporting period.
How often should you report on paid search?
Most teams benefit from three cadences. Weekly snapshots track spend pacing and flag significant metric movements. Keep these brief, one page or less. Monthly deep dives analyse full-funnel performance with period-over-period comparisons and detailed recommendations. Quarterly strategy reviews assess whether campaign structures, targeting, and budget allocation still align with business goals. The right cadence depends on the account's complexity and the stakeholder's involvement level.
What is the difference between paid search analytics and reporting?
Paid search analytics is the process of examining campaign data to identify patterns, diagnose problems, and find opportunities. Reporting is the act of packaging those findings into a structured format for stakeholders. Analytics answers "what is happening and why?" Reporting answers "what do stakeholders need to know and what should we do next?" Strong reporting is built on strong analytics, but they serve different purposes. You can do analytics without producing a report, and you can produce a report without doing meaningful analytics, though you should not. For a deeper look at the analysis side, see our guide on paid search analysis.
What metrics matter most in paid search?
The most important metrics depend on the campaign objective. For lead generation, CPA and conversion rate are primary. For e-commerce, ROAS and revenue are the focus. For brand awareness, impression share and CTR matter most. Regardless of objective, budget utilisation and CPC should always be tracked to ensure spend efficiency. Avoid including metrics in your report simply because they are available. Every metric should connect to a decision the stakeholder can make.
What is the best paid search reporting tool?
It depends on your stack. For Google-only accounts, Google Ads built-in reports or the free Looker Studio cover most needs. For multi-channel agency reporting with white-label delivery, AgencyAnalytics or Supermetrics are the established options. For paid media teams that need to document active management rather than just performance, Pace generates cross-platform change reports that log every budget adjustment with the reasoning behind it, alongside a unified pacing view across Google, Meta, TikTok, LinkedIn, and Microsoft Ads.
How Pace handles paid search reporting
Pace approaches paid search reporting from a different angle than traditional dashboarding tools. Instead of static charts and KPI widgets, Pace generates change reports that log every automated budget adjustment with the reasoning, hypothesis, and data points behind each decision. When Pace increases a campaign's daily budget because it's underpacing, the report captures the original budget, the new budget, the pacing calculation, and the expected outcome.
The cross-platform pacing view shows spend progress across Google, Meta, TikTok, LinkedIn, Microsoft, Reddit, X Ads, and Amazon Ads in a single interface. Instead of switching between four platform dashboards to assess performance, agencies see a unified view of budget consumption, pacing status, and projected month-end landing for every account. Combined with Findings (automated anomaly detection that only surfaces high-signal insights like CPA spikes, creative fatigue, and zero-conversion spend), Pace turns reporting from a manual time cost into continuous, automated oversight.
This is particularly valuable for teams that have struggled with the "what are you actually doing for us?" question. Change reports with full audit trails make the answer visible and verifiable. Combined with automated pacing adjustments, Pace turns paid search reporting from a deliverable you build into a capability your platform provides.
Pace is available with a 14-day free trial that includes every Enterprise feature. Start a free trial to get started.

Jordan Parrello
Founder of Pace. Ran an agency pacing sheet by hand for years before building the thing that checks it every 5 minutes. About Pace or LinkedIn