What Is Paid Search Analysis?
Paid search analysis is the ongoing job of pulling apart your PPC data to find patterns, waste, and opportunities. It applies to every paid channel where you bid on keywords or audiences (Google Ads, Microsoft Ads, Shopping, Performance Max) and turns raw numbers into decisions. If you need a primer on the channel itself before getting into the analysis layer, start with our complete guide to paid search marketing.
Analysis and auditing are not the same thing, even though people use the words interchangeably. A PPC audit is a snapshot. A health check that flags configuration errors, tracking issues, and obvious waste at a single point in time. Analysis is what happens between audits, and it asks a different question. Not "is this set up correctly?", but "is this improving, declining, or plateauing, and why?"
Agencies that only audit periodically tend to catch problems after they have already cost money. Continuous analysis catches them as they emerge. It also surfaces opportunities that audits miss entirely, because opportunities only become visible when you track performance over time and compare it against a benchmark.
Done properly, PPC analysis comes down to three things: the metrics worth watching, a repeatable process for working through them, and tools that close the gap between data and action. The rest of this guide covers each.
Key Metrics for PPC Analysis
Not every metric earns the same attention. Which ones matter most depends on the business objective, but there is a core set every paid search analysis should cover. Here is what each one tells you, and when it is signalling a problem you should actually investigate.
Cost per acquisition (CPA). How much you spend to generate one conversion. For lead-gen accounts, this is the most direct measure of efficiency. When CPA rises above target, something shifted. Competition may have crept up, ad relevance may have dropped, or your landing page conversion rate may have declined. A trend over 14 to 30 days is worth investigating. A single-day spike usually is not.
Return on ad spend (ROAS). For ecommerce and revenue-tracked campaigns, ROAS replaces CPA as the primary efficiency measure. It tells you how much revenue each dollar of ad spend generates. A ROAS of 4.0 means every dollar spent returns four in revenue. When ROAS drops, the cause is usually lower average order values, declining conversion rates, or rising CPCs. Segment by campaign and device to find the source.
Click-through rate (CTR). The share of impressions that turn into clicks. Low CTR on Search campaigns typically means poor ad copy relevance or weak keyword-to-ad alignment. On branded campaigns, CTR should sit at 15% or higher. On non-brand, 3% to 8% is a reasonable range depending on the industry. CTR below 2% on non-brand Search means your keywords are too broad, your ad copy is not compelling, or both.
Conversion rate. The share of clicks that turn into the action you actually want. A declining conversion rate with stable CTR points to a landing page problem rather than an ad problem. Compare across devices (mobile vs. desktop often differ by 30% or more) and across campaign types. If Search converts at 5% but Shopping converts at 1.5%, the gap may be normal, or it may flag a feed or landing page issue worth fixing.
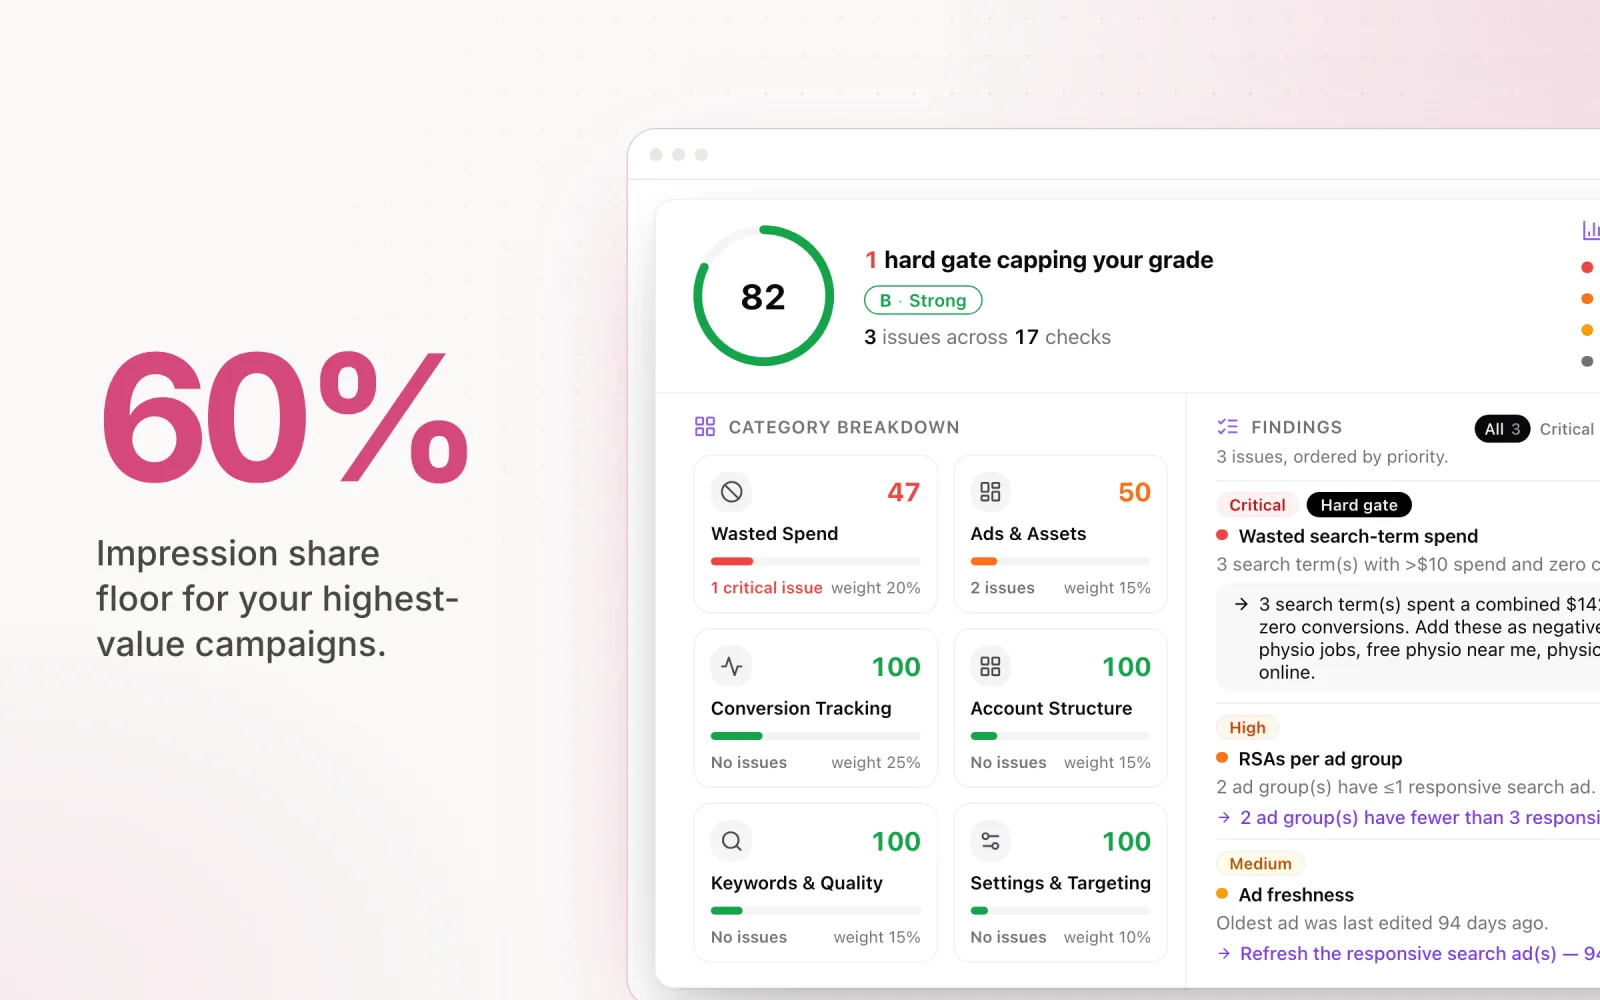
Impression share (search and absolute top). How much of the available search inventory you are actually capturing. Search impression share below 60% on your highest-value campaigns means competitors are showing up where you are not. Absolute top impression share tells you how often your ad lands in the very first position. For brand campaigns, that should be 90% or above. "Lost to budget" means spending more would capture more impressions. "Lost to rank" means quality scores or bids need work.
Quality score. Google's 1-to-10 rating of keyword relevance, ad relevance, and landing page experience. Keywords with quality scores below 5 are paying a premium on every click. It does not change daily, but month-over-month it tells you whether your cost efficiency is drifting. A drop from 7 to 5 on a high-volume keyword can push CPCs up 20% to 40% with no change in competition.
Cost per click (CPC) trends. Absolute CPC values matter less than the trend. A gradual rise over 90 days signals increasing competition, declining quality scores, or both. Compare your trend against industry benchmarks to figure out whether it is market-wide or specific to your account. If CPCs are rising but conversion rates are stable, your CPA will follow proportionally, and that becomes either a budget conversation with the client or an efficiency push.
Search term relevance ratio. Platforms do not report this one natively, which is exactly why it is one of the most useful numbers you can track. Pull the search terms report, tag each query as relevant, partially relevant, or irrelevant, and calculate what percentage of spend each bucket gets. Most accounts I look at have 15% to 25% of search term spend going to queries that have nothing to do with the offer. Reduce that by even 5 points and you free up real budget for terms that actually convert.
How to Run a PPC Campaign Analysis
Metrics on their own are useless. Without a repeatable process, "analysis" turns into clicking around dashboards and hoping something jumps out. Here is a step-by-step approach that keeps it focused.
Step 1: Define the time window. The window determines what kind of insight you can pull. Use 7 days for tactical analysis: sudden shifts, pacing issues, search term anomalies. Use 30 days for trend analysis: is performance improving, declining, or flat? Use 90 days for strategic analysis: is the overall trajectory aligned with what the business actually wants? Running all three at the same time gives you a complete picture.
Step 2: Segment by campaign type. Mixing Search, Shopping, Performance Max, and Display in the same view produces averages that mislead you. A Search campaign with a 4% CTR is performing well. A Display campaign with a 4% CTR would be extraordinary. Segment first, then analyse each type against its own benchmarks. Same goes for brand vs. non-brand Search. Combine them and your apparent CTR and conversion rate get inflated, which hides problems in non-brand.
Step 3: Compare performance against targets. Every campaign should have explicit targets. Actual CPA vs. target CPA. Actual spend vs. budgeted spend. Actual ROAS vs. target ROAS. This is where analysis starts producing findings. A campaign with a $40 CPA target delivering at $55 is 37.5% over. That is a finding. It requires investigation.
Step 4: Identify outliers. Flag any campaign 20% or more above or below target on any key metric. Outliers are where the real optimisation opportunities live. A campaign 20% below its CPA target is outperforming and may justify more budget. A campaign 30% above its target is bleeding and needs intervention. Sort by magnitude of deviation and you have a prioritised to-do list.
Step 5: Drill into the outlier. For each flagged campaign, drill down through the hierarchy. Campaign to ad group. Ad group to keyword. Keyword to search term. Ad group to ad copy. The goal is to isolate the specific element causing the deviation. Often it is a single high-spend keyword with awful search term quality dragging the whole campaign's CPA up. Sometimes it is one ad variant tanking the ad group average. Drilling down stops you from making campaign-level changes when the actual problem is at the keyword level.
Step 6: Document findings and actions. Every analysis should produce a written record. What you found, what you concluded, what you did about it. This is your audit trail for the team and your communication tool for the client. Skip it and analysis becomes ephemeral. You make changes, lose the reasoning, and three months later cannot tell whether your decisions were correct.
The Best PPC Analysis Tools
The right tools shrink the gap between question and answer. Doing this manually inside platform UIs is possible, but slow, especially across multiple channels. Here is how the main options compare.
Google Ads built-in reporting. Solid for single-account work. The search terms report, auction insights, and bid strategy reports cover the most important checks. Custom columns let you build calculated metrics (like your relevance ratio), and the report editor handles segmentation and filtering. Best for: day-to-day tactical work inside one Google Ads account. Limitation: no cross-platform visibility, and historical comparison is thin.
Optmyzr. Deep analysis for Google and Microsoft Ads, with rule-based automation that can execute changes off the back of what you find. The strength is that analysis and action live in the same workflow. You can spot underperforming keywords and bulk-change them without leaving the tool. The rule engine lets you codify your framework and run it on a schedule. Best for: agencies that want their analysis process to run itself across Google and Microsoft.
SEMrush. SEMrush is at its best on competitive analysis. The Advertising Research tool shows you which keywords competitors are bidding on, what their ad copy looks like, and how their spend has shifted over time. That external view fills in the gaps that internal account data cannot. Best for: competitive intelligence, ad copy research, and finding keyword gaps in your strategy.
SpyFu. SpyFu is more narrowly focused on competitor keyword and ad intelligence. It pulls historical data on competitor ad spend estimates, keyword rankings, and ad copy variations going back years. Useful for tracing how a competitor's strategy has evolved and which keywords they have stayed committed to. Best for: deep competitor keyword work and historical ad copy research.
Supermetrics. Not an analysis tool. A data pipeline. It connects your ad platforms to Google Sheets, Looker Studio, and BigQuery, automating the extraction step so you can build your own analysis in tools your team already lives in. Best for: agencies that want custom dashboards and reports without exporting CSVs every Monday.
Pace Ads. Pace runs cross-platform paid search analysis with AI insights and anomaly detection. It connects to Google, Meta, TikTok, LinkedIn, Microsoft, Reddit, X Ads, and Amazon Ads and watches performance against your targets continuously. When something moves materially (CPA spike, impression share drop, weird spend pattern), Pace flags it and tells you what changed. The work happens in the background, so instead of running a manual review you respond to prioritised alerts. Best for: agencies managing across multiple platforms that want analysis without the manual overhead. (This is what we built, and yes, I am biased.)
Building a PPC Analysis Report
Analysis that stays in your head or in your private notes does not drive results. A PPC analysis report turns findings into something a stakeholder can read and act on. Whether the audience is your internal team or a client, structure matters as much as content.
Executive summary. Start with three bullets that answer the question "what happened and what are we doing about it?" Anyone who reads only these three lines should still walk away knowing the situation. For example: "CPA increased 18% month-over-month, driven by rising CPCs on non-brand Search. Search term analysis showed a 22% irrelevance ratio. We are adding 45 negative keywords and testing new ad copy to lift quality scores."
KPI dashboard. Present the four to six metrics that matter: total spend, CPA or ROAS, conversion volume, CTR, and impression share. Show the current period next to the previous period and the target. That three-column comparison (actual vs. prior vs. target) makes it immediately clear where things stand against both history and goals.
Campaign-level breakdown. For each campaign, show the key metrics and flag any that are more than 20% above or below target. Colour coding helps. Green for on-target, amber for 10% to 20% deviation, red for more than 20%. The reader can scan 20 campaigns and know exactly which ones need attention.
Search term insights. Include the top 10 converting search terms and the top 10 wasting them. This section reliably generates more discussion in client meetings than any other, because it reveals what people are actually typing when they click your ads. It also shows you are actively managing search term quality, not just running campaigns on autopilot.
Competitive intelligence. Summarise auction insights trends. Which competitors gained impression share, which lost it, and whether any new ones have entered the auction. This external context explains performance changes that nothing inside the account would explain on its own.
Recommended actions. Close the report with a numbered list of specific actions, each tied to a finding. "Add 30 negative keywords to Campaign X" is actionable. "Improve campaign performance" is not. Every recommendation should be concrete enough that someone could execute it without asking you a follow-up question.
The reports that generate the most value tell a story instead of dumping data. A table of numbers is a data dump. A report that says "CPA rose because competition intensified on these five keywords, and here is what we are doing about it" is analysis. For more on this, read our guide on why PPC reports should include a change log.
Common PPC Analysis Mistakes
Even seasoned PPC managers fall into traps that lead to bad calls. Recognising the patterns is as important as knowing the framework.
Focusing on vanity metrics. Impressions, clicks, and CTR are activity metrics. They measure engagement, not outcome. An agency reporting "clicks up 40%" without mentioning conversions stayed flat and CPA rose 25% is telling half the story. Anchor analysis to business outcomes (conversions, revenue, cost efficiency). Activity metrics give context, but they should not be the headline.
Analysing too short a window. Three-day snapshots are noisy. A campaign that looks terrible on Monday might look fine by Friday. Auction dynamics, day-of-week patterns, and algorithm learning cycles all introduce short-term volatility that washes out over longer windows. Use at least 7 days for tactical decisions and 30 for trend conclusions. The one exception is budget pacing, where daily monitoring is appropriate because overspend compounds fast.
Ignoring attribution model differences. Google Ads defaults to data-driven attribution, which spreads conversion credit across multiple touchpoints. If you are comparing Google Ads conversions to Meta conversions, and Meta is on a 7-day click, 1-day view window, the numbers are not directly comparable. Skip that and you misallocate budgets based on false conclusions about channel performance. Document which model each platform uses, and note the caveat in every cross-platform analysis.
Not segmenting by campaign type. Averaging Search and Display metrics together produces numbers that misrepresent both. Search typically has higher CTRs, higher conversion rates, and higher CPCs. Display has lower CTRs, lower CPCs, and different conversion behaviour. Performance Max adds another layer because it blends Search, Display, Shopping, and YouTube into one campaign. Segment before you analyse, or your conclusions are built on averages that lie.
Analysing spend without pacing context. A campaign that has spent 80% of its monthly budget by the 15th looks alarming on its own. But if the budget was front-loaded on purpose to ride a seasonal surge, it is performing as planned. Spend analysis without pacing context produces wrong conclusions and unnecessary interventions. Always ask "is this spend level planned?" before flagging it. Understanding flight dates and intentional budget shifts saves you from chasing false alarms.
Paid search analysis done properly is the difference between reactive management and management with foresight. The framework above (clear metrics, structured process, proper tools, documented reporting) turns raw data into decisions that compound over time. Pace surfaces the anomalies that actually matter across Google, Meta, TikTok, LinkedIn, and Microsoft Ads, so you spend less time pulling data and more time acting on it. Start a free trial to see it in action.

Jordan Parrello
Founder of Pace. Ran an agency pacing sheet by hand for years before building the thing that checks it every 5 minutes. About Pace or LinkedIn