A client in Melbourne wants to launch in London and Los Angeles next quarter and asks what the clicks will cost. You search for a country benchmark and find five of them. One says the UK averages £1.64 a click. Another says £3.42. One says a US click is US$2.69, another says US$7.66. None of them are wrong, exactly. They are measuring different things.
This post puts the published Australian, UK and US numbers side by side, explains why they disagree, and ends with the number you should actually build the media plan on. If you want the vertical view instead, our Google Ads CPC by industry post has the full 23-industry table.
Google Ads CPC in Australia, the UK and the US
Five sources, three countries. Each figure is shown in the currency its source published it in. We haven't converted anything, because an exchange rate on top of a model adds a second layer of guesswork.
| Source | What it measures | US | Australia | UK |
|---|---|---|---|---|
| Semrush, via Statista (Dec 2024) | Measured average CPC | US$7.66 | US$3.55 | US$3.47 |
| Adbenchly model (Jun 2026) | Modelled average, local currency | US$2.69 | A$3.34 | £1.64 |
| LocaliQ (Apr 2025 to Mar 2026) | Average across US search campaigns | $5.42 | – | – |
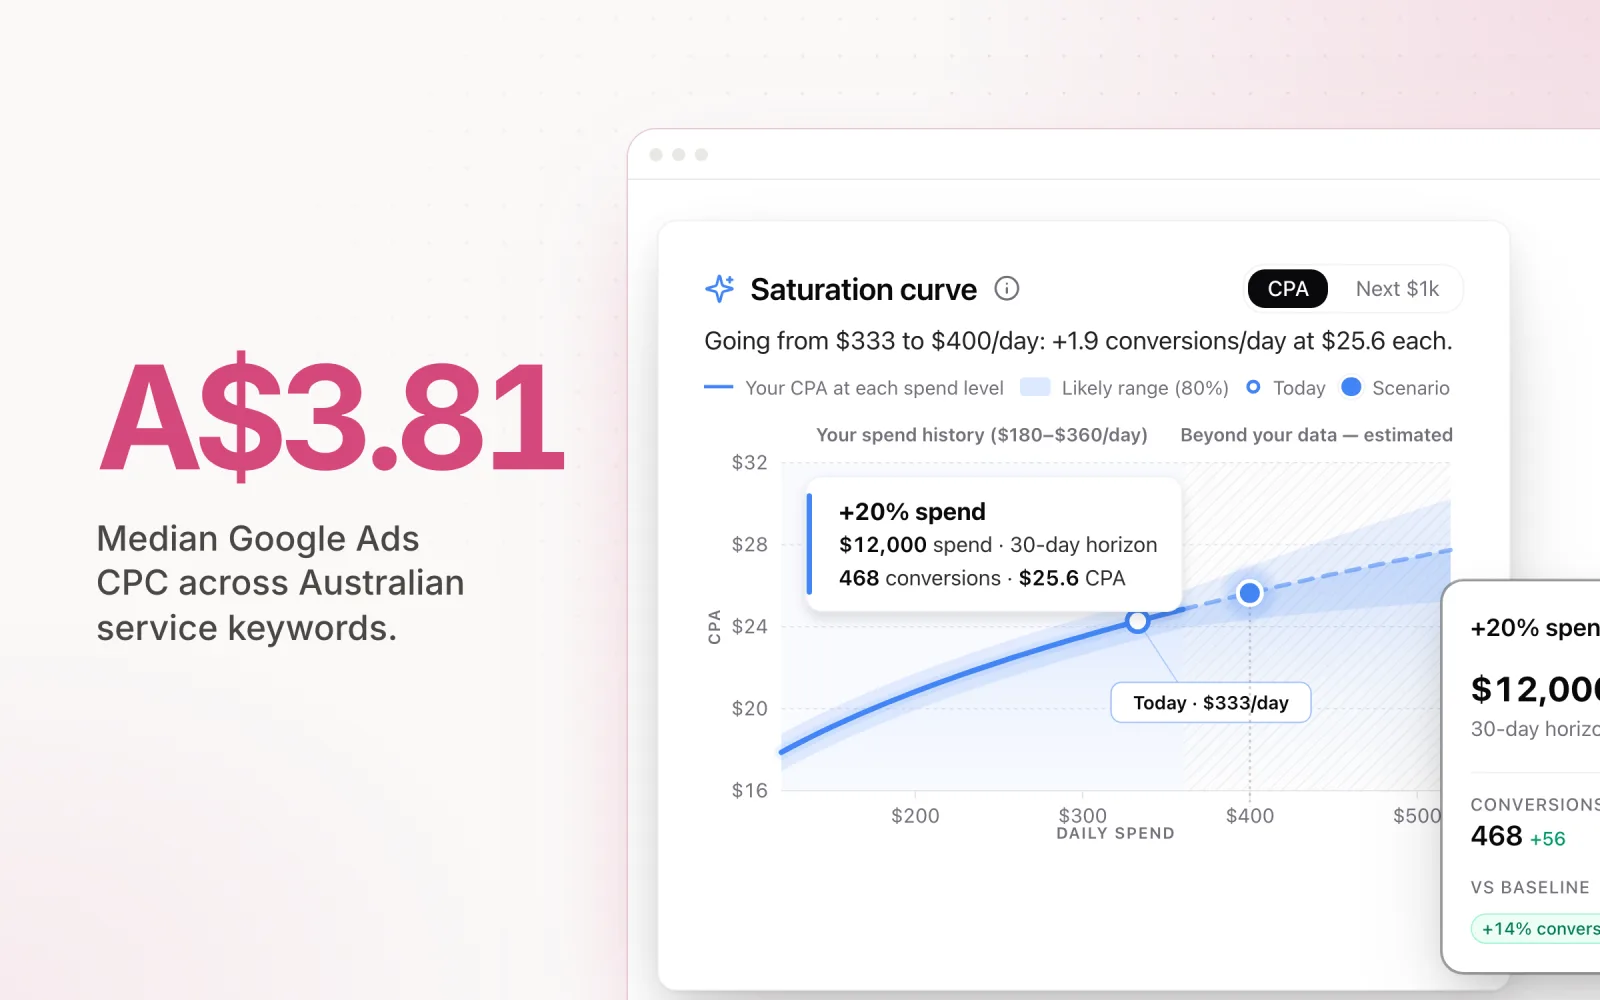
| DNHQ Click Price Index (May 2026) | Median of 8,400+ service keywords | – | A$3.81 | – |
| Visionary Marketing (Mar 2025 to Feb 2026) | Average across 240 managed accounts | – | – | £3.42 |
The one comparison you can make cleanly is inside a single source. On Semrush's measured data, all in US dollars, an Australian click cost 46% of a US click and a UK click cost 45%. Australia and the UK land within a few cents of each other. The US is roughly double both.
The Semrush figures are behind Statista's paywall, so we've taken them as Adbenchly reports them. They're also the oldest numbers here. Treat the ratio as the useful part, not the dollar values.
Why every country benchmark tells a different story
Put the US figures in a row and they run from US$2.69 to US$7.66. Most of that gap comes from how each source counts.
- Measured or modelled. Semrush and LocaliQ report what advertisers paid. Adbenchly's local-currency table is a model, checked against measured data but not built from it. A model can smooth out the expensive tail, which may be why its US number is the lowest of the lot.
- Average or median. An average is dragged up by legal, insurance and home services, where clicks run into double digits. A median tells you what the middle keyword costs. DNHQ's A$3.81 is a median. Most of the rest are averages.
- Accounts or keywords. LocaliQ and Visionary Marketing average what real accounts were billed. DNHQ takes the median of keyword-level average CPCs across its keyword list. One tells you what advertisers paid, the other what a typical keyword costs.
- What got sampled. LocaliQ covers its own customers' US accounts. Visionary Marketing covers 240 accounts it manages. DNHQ covers service keywords only, so ecommerce is barely in it. Change the mix and you change the answer.
- When. The measured Semrush snapshot is from December 2024, a seasonal peak month for retail. The others cover full years or recent months.
None of this makes the benchmarks useless. It means you read each one for what it is, rather than lifting the first number into a client deck.
Australia: A$3.34 to A$3.81, and the city matters
The two Australian figures agree more than the UK or US ones do. Adbenchly's modelled average is A$3.34. DNHQ's median across more than 8,400 Australian service keywords is A$3.81. If you need one national number for a first conversation, A$3.50 to A$4.00 is a fair working range.
The vertical spread inside that is huge. DNHQ's index puts legal at a A$17.48 median, trades at A$9.25 and real estate at A$8.46, while beauty and personal care sits at A$1.56 and hospitality at A$0.79.
Location moves it again. For "service + city" keywords, DNHQ found Sydney at A$23.21, Brisbane at A$18.75 and Adelaide at A$13.70. Those are high-intent local searches, not the national average, but the gap between Sydney and Adelaide is the part worth keeping. The same plumber keyword can cost 70% more in one capital than another.
UK: £1.64 to £3.42, plus a London premium
The UK has the widest spread of the three. Adbenchly's model gives £1.64. Visionary Marketing's analysis of US$6 million of spend across 240 accounts gives £3.42 for the year to February 2026, up from £2.96 a year earlier and £2.18 in 2022. That's a 57% rise in four years on the same method, which says more about direction than any single figure does.
Whito's 2026 UK cost research puts most SMEs at £1.50 to £2.50 a click, and finds London campaigns run 15 to 30% more per click than the rest of the country. If your UK launch is London-only, plan at the top of the range.
Watch the currency in UK reports. Several UK benchmark reports publish in US dollars with a sterling conversion alongside. Check which one the source measured in before you compare it with a local figure.
Which number to build the budget on
None of the above. National benchmarks are useful for one thing: telling a client roughly what a market costs before they commit to looking at it. The moment there's a keyword list, they stop being the best number available.
Price your own keywords
Run the actual keyword list through Google Keyword Planner with the location set to the target market, or the target city if the campaign is local. Use the top-of-page bid range, not the national average.
Turn CPC into CPA
Divide the expected CPC by the conversion rate you expect. At A$3.81 a click and a 4% conversion rate, a lead costs A$95. The CPA calculator does this for you.
Check the CPA against what a customer is worth
If the lead cost is fine at the low end of the bid range and broken at the high end, you've found the real risk in the plan before any money moves.
Replace estimates with actuals after two weeks
Once the account has its own click data, that beats every benchmark here. Re-forecast from it, and track spend against the plan daily so the new market doesn't eat the month's budget in a fortnight.
For multi-market launches the CPC gap also changes how budgets should split. On Semrush's numbers a dollar buys roughly twice as many clicks in Australia or the UK as in the US, so an even split across the three markets is rarely an even test. Our guide to forecasting ad spend across platforms covers how to weight it.
Frequently asked questions
What is the average Google Ads CPC in Australia?
Between A$3.34 and A$3.81 for most planning purposes. Adbenchly's June 2026 model puts the Australian average at A$3.34, and the DNHQ Australian Click Price Index puts the median across 8,400+ Australian service keywords at A$3.81 (May 2026). Legal keywords run far higher, at a A$17.48 median, and hospitality far lower, at A$0.79.
Is Google Ads cheaper in Australia than in the US?
Yes, per click. Semrush data from December 2024 put the average US click at US$7.66 and the average Australian click at US$3.55, so an Australian click cost about 46% of a US one. LocaliQ's 2026 benchmark, which covers US accounts only, puts the US average at $5.42. Either way the US is the most expensive of the three markets.
What is the average Google Ads CPC in the UK?
Published figures range from £1.64 to £3.42. Adbenchly's June 2026 model gives £1.64. Visionary Marketing's analysis of 240 managed accounts gives £3.42 for March 2025 to February 2026, up from £2.18 in 2022. London campaigns typically cost 15 to 30% more per click than the rest of the UK.
Why do Google Ads CPC benchmarks by country disagree?
Because they measure different things. Some are averages of what advertisers actually paid, some are models, and some are medians of keyword bid estimates. They also sample different industries and keyword types. An average is pulled up by expensive verticals like legal, so it sits well above what a typical account pays.
Sources: Adbenchly, Google Ads cost by country (Semrush/Statista measured data and June 2026 model, updated July 2026); LocaliQ Search Advertising Benchmarks 2026; DNHQ Australian Click Price Index (May 2026); Visionary Marketing Google Ads benchmarks 2026; Whito UK PPC costs (updated September 2026).

Jordan Parrello
Founder of Pace. Ran an agency pacing sheet by hand for years before building the thing that checks it every 5 minutes. About Pace or LinkedIn