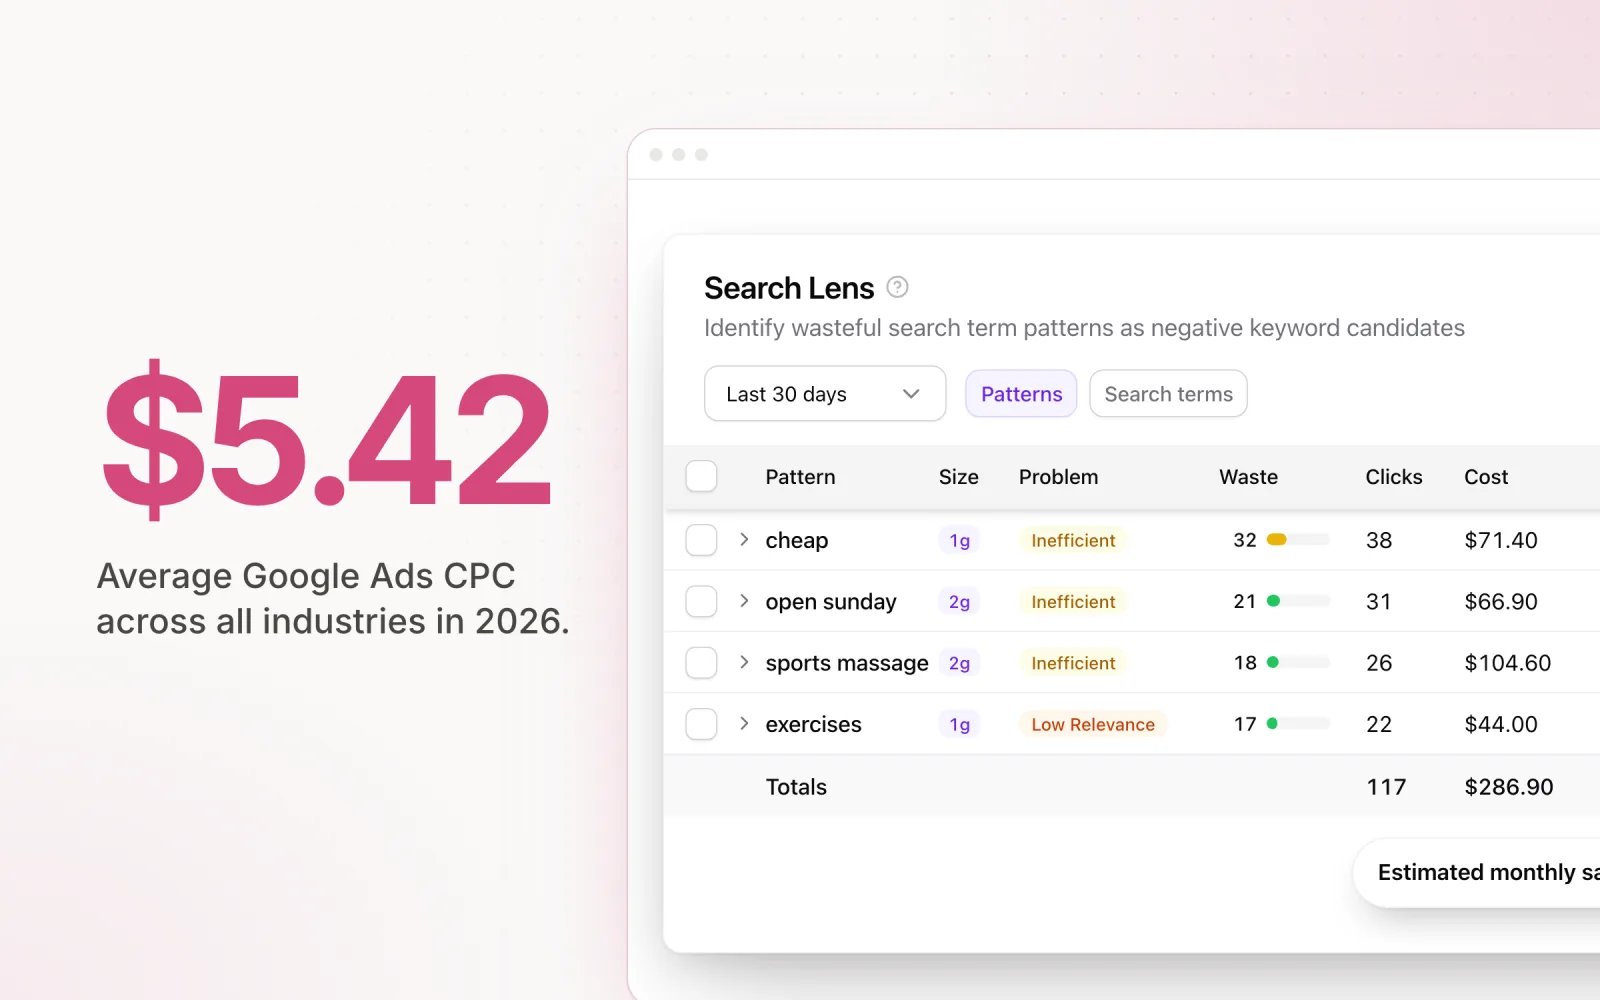
"Is $9 a click normal?" depends entirely on who is asking. For a personal injury firm, $9 is a Tuesday. For a travel agency it means something is badly wrong with the account. The all-industry average Google Ads CPC in 2026 is $5.42, and almost nobody pays the average.
This post is the full industry table from LocaliQ's 2026 search advertising benchmark, plus the columns people skip when they screenshot the CPC one. If you want the wider picture on spend, market share and automation, the Google Ads statistics page has 80 sourced numbers. This one is just about what a click costs and what that price tells you, which is less than people think.
The 2026 table: CPC, CTR, conversion rate and cost per lead by industry
Averages, not medians. Google and Microsoft Ads search campaigns across LocaliQ and WordStream customer accounts, April 2025 to March 2026. Sorted by cost per click.
| Industry | Avg CPC | CTR | Conv. rate | Cost per lead |
|---|---|---|---|---|
| All industries | $5.42 | 6.64% | 8.18% | $66.69 |
| Attorneys & Legal Services | $9.87 | 5.87% | 5.55% | $131.63 |
| Home & Home Improvement | $8.33 | 6.47% | 8.05% | $90.92 |
| Dentists & Dental Services | $8.00 | 5.66% | 10.67% | $72.97 |
| Personal Services | $7.17 | 7.16% | 12.34% | $54.60 |
| Health & Fitness | $6.17 | 5.81% | 6.94% | $67.36 |
| Business Services | $5.87 | 6.10% | 4.85% | $93.69 |
| Industrial & Commercial | $5.87 | 6.57% | 8.20% | $75.19 |
| Career & Employment | $5.81 | 5.88% | 3.05% | $67.36 |
| Education & Instruction | $4.81 | 7.56% | 13.14% | $77.48 |
| Physicians & Surgeons | $4.76 | 6.61% | 12.43% | $40.04 |
| Beauty & Personal Care | $4.62 | 6.75% | 10.35% | $39.25 |
| Apparel, Fashion & Jewelry | $4.44 | 6.64% | 4.50% | $97.51 |
| Automotive: Repair, Service & Parts | $4.35 | 5.56% | 15.51% | $29.96 |
| Shopping, Collectibles & Gifts | $4.14 | 8.28% | 4.01% | $49.40 |
| Animals & Pets | $4.06 | 7.49% | 16.22% | $31.50 |
| Furniture | $3.97 | 6.57% | 2.99% | $106.70 |
| Finance & Insurance | $3.39 | 9.83% | 2.64% | $74.44 |
| Real Estate | $3.22 | 7.61% | 3.70% | $102.51 |
| Sports & Recreation | $2.77 | 8.75% | 7.69% | $44.26 |
| Automotive: For Sale | $2.27 | 8.28% | 6.01% | $44.26 |
| Travel | $2.14 | 9.32% | 5.83% | $44.70 |
| Restaurants & Food | $2.05 | 6.83% | 8.05% | $30.57 |
| Arts & Entertainment | $1.63 | 12.75% | 5.91% | $26.84 |
Source: LocaliQ Search Advertising Benchmarks 2026, last updated 1 June 2026.
Read the last column, not the second one
Cost per click is a price. Cost per lead is a result. The table is full of industries where the two point in opposite directions, and those are the rows worth knowing by heart.
- Finance & Insurance looks cheap at $3.39 a click, well under the average. Then it converts 2.64% of those clicks, the worst rate in the table, and the cost per lead lands at $74.44. Above average. The cheap click was a trap.
- Real Estate is the same story with worse numbers: $3.22 a click, 3.70% conversion, $102.51 a lead. The second most expensive lead in the table, bought with the fifth cheapest click.
- Furniture has the lowest conversion rate of any vertical outside finance (2.99%) and the third highest cost per lead ($106.70). Nobody buys a sofa on the first click.
- Animals & Pets and Automotive Repair go the other way. Both pay slightly under the average CPC and convert 15 to 16% of clicks, which gets them leads at around $30. Emergency intent converts.
- Legal is expensive on every axis, which is at least honest. $9.87 a click, a middling 5.55% conversion rate, $131.63 a lead. A firm that closes one in ten of those leads is paying about $1,300 per client, and for most practice areas that is a good deal.
The spread on CPC is six-fold, $1.63 to $9.87. The spread on cost per lead is five-fold, $26.84 to $131.63. But the ranking changes completely between the two columns, and the second one is the one your client's finance team cares about.
Are clicks getting more expensive?
Yes, but by less than the panels say. LocaliQ's all-industry CPC has gone $3.53 to $5.42 across five editions of the same report, 2021 to 2026, which is a 54% rise. The 2025-to-2026 move was $5.26 to $5.42, a 3% step and the smallest in the series.
Alphabet publishes its own cost-per-click growth in its filings, audited, across every advertiser on the platform. That number rose 7% for full-year 2025 and 4% for the first half of 2026. Tinuiti's Q2 2026 benchmark, drawn from large-advertiser accounts, had Google search CPC up just 1% year on year, with non-brand terms up 4% and brand terms down 1%.
So three sources, three answers: 3%, 4% and 1% for the most recent year. My read is that clicks got a few percent more expensive in the past twelve months, the sharp rises were in 2022 and 2023, and the "CPC is up 50%" line you'll hear in pitches is a five-year figure from one SMB-heavy panel. Quote it if you like, but know where it comes from.
Why your CPC won't match the table
Even inside one industry, two accounts can sit at opposite ends of the range. These are the usual reasons, roughly in order of how often they explain the gap.
Brand mix. Brand keywords cost a fraction of non-brand and convert several times better. An account that is 40% brand spend will report a blended CPC well under the benchmark and look brilliant. Strip brand out before you compare anything.
Match type and query quality. Broad match on a $9 vertical buys a lot of $9 clicks from people who wanted something else. The CPC looks fine; the cost per lead doesn't. Search term reports still matter, even with Smart Bidding doing the bidding.
Where and when. Metro versus regional, business hours versus 2am, desktop versus mobile. The same keyword can cost double in one city and at one hour. If you're not already scheduling bids around it, the dayparting guide covers how. Country moves it most of all: this table is US data, and an Australian or UK click costs roughly half a US one, as our Google Ads CPC by country comparison shows.
Ad relevance and landing page. Google discounts clicks for ads it expects people to click and pages it expects them to stay on. This is the lever most accounts under-pull, because it means writing and testing rather than adjusting a bid.
Who else is bidding this month. Legal and home services CPCs swing with local competition. A new entrant with a big budget moves everyone's price for a quarter. Auction Insights will show you the new name before the CPC chart does.
How to use this table with a client
Benchmarks are most dangerous when they arrive by screenshot, with no context, in a client's inbox. Here's the order I'd use them in.
- Their own trailing three months first. Same campaigns, same geography, brand excluded. If the CPC moved, that's the number to explain. If it didn't, the benchmark conversation is academic.
- The industry row second, and read the whole row. "You're paying $8 a click, the average for dental is $8, and your cost per lead is $60 against a $73 benchmark" is a complete sentence. "You're paying $8 a click" is not.
- Cost per lead or cost per acquisition is the verdict. CPC is the diagnosis. If the lead cost is fine, an above-benchmark CPC is the account buying better clicks. If the lead cost is bad and CPC is fine, the problem is the landing page or the query mix, and bidding won't fix it.
Where CPC meets the budget
What a CPC rise does to an agency is quieter than the chart suggests. A campaign with a fixed monthly budget doesn't overspend when clicks get 15% dearer. It buys 13% fewer clicks, results thin out, and the account looks like it "stopped working" around the third week of the month. The panicked fix, cutting budgets or bids mid-flight, usually costs more than the CPC rise did.
The clean way to handle it is to know your pacing position every day rather than discovering it at month end, and to move budget between campaigns based on what each one is returning at today's prices, not last quarter's. That's the job Pace does across Google, Microsoft, Meta and the rest: it reads spend and results from the platform's own account-level numbers, works out where each budget will land, and reallocates toward the campaigns still returning at the current cost per click. CPC inflation stops being a surprise and becomes a line in a report.
Google Ads CPC FAQs
What is the average Google Ads CPC in 2026?
LocaliQ's 2026 benchmark, covering Google and Microsoft search campaigns from April 2025 to March 2026, puts the all-industry average cost per click at $5.42. The spread by industry is wide: $1.63 in Arts & Entertainment up to $9.87 in Attorneys & Legal Services. Alphabet's own audited cost-per-click metric rose 7% in 2025 and 4% in the first half of 2026, so the market-wide rise is real but smaller than agency panels suggest.
Which industry has the highest Google Ads CPC?
Attorneys & Legal Services at $9.87 per click in the 2026 LocaliQ benchmark, followed by Home & Home Improvement at $8.33 and Dentists & Dental Services at $8.00. Legal also has the highest cost per lead at $131.63. The cheapest clicks are in Arts & Entertainment ($1.63), Restaurants & Food ($2.05) and Travel ($2.14).
Is a high CPC in Google Ads bad?
Not on its own. CPC is a price, not a result. Finance & Insurance has a below-average $3.39 CPC but a 2.64% conversion rate, giving a $74.44 cost per lead, while Animals & Pets pays $4.06 per click and converts 16.22% of them for a $31.50 cost per lead. Judge the account on cost per lead or cost per acquisition against its own history first, the industry benchmark second, and CPC last.

Jordan Parrello
Founder of Pace. Ran an agency pacing sheet by hand for years before building the thing that checks it every 5 minutes. About Pace or LinkedIn