A client forwarded me a LinkedIn benchmark report last month with one line highlighted: average CPM $85. Their campaigns were paying $41. Were they getting a bargain, or was the report measuring something else? It was measuring something else. The report's panel was 40 enterprise campaigns targeting directors and above in North America. The client was selling accounting software to owners of 20-person firms.
That gap is the whole story of LinkedIn benchmarks. Meta and Google averages are noisy but roughly comparable between sources. LinkedIn averages are not, because LinkedIn pricing is dominated by two things the platform lets you dial up almost without limit: how senior the audience is and how narrow it is. Change either and the "average" doubles. So this post puts four of them side by side, explains what each one actually measured, and then gives you the ranges I'd plan with.
Four 2026 reports, side by side
| Source (published) | What it measured | CPM | CPC | CTR | CPL |
|---|---|---|---|---|---|
| Digital Applied (Apr 2026) | Q1 2026, 140+ agency-managed B2B accounts plus platform aggregates | $33.80 | $5.74 | 0.61% | $94 |
| Benly (Mar 2026) | Cross-industry medians with low/high bands | $38 ($25–65) | $7.50 ($4.50–15) | 0.45% | $95 ($50–200) |
| ClickMinded (Jul 2026) | Planning ranges synthesised from public B2B sources | $30–90 | $6–15 | 0.4–1.0% | $75–300 |
| The Smarketers (Jun 2026) | 40 enterprise B2B campaigns, $8.4M spend, North America broad targeting | $55–85 | — | 0.5–1.2% | $180–380 (mid-market) |
Read down the CPM column and the pattern is obvious. The two sources built on broad, mixed-seniority panels land in the mid-30s. The one built on enterprise campaigns starts at $55. The planning-range source spans both. None of them is wrong. They are measuring different auctions.
Why the numbers move so much: seniority and audience size
Digital Applied's breakdown by seniority is the clearest illustration of LinkedIn pricing I've seen published this year.
| Audience seniority | CPM | CPC | CPL |
|---|---|---|---|
| Individual contributor | $19.40 | $3.18 | $48 |
| VP / SVP | $78.90 | $11.20 | $202 |
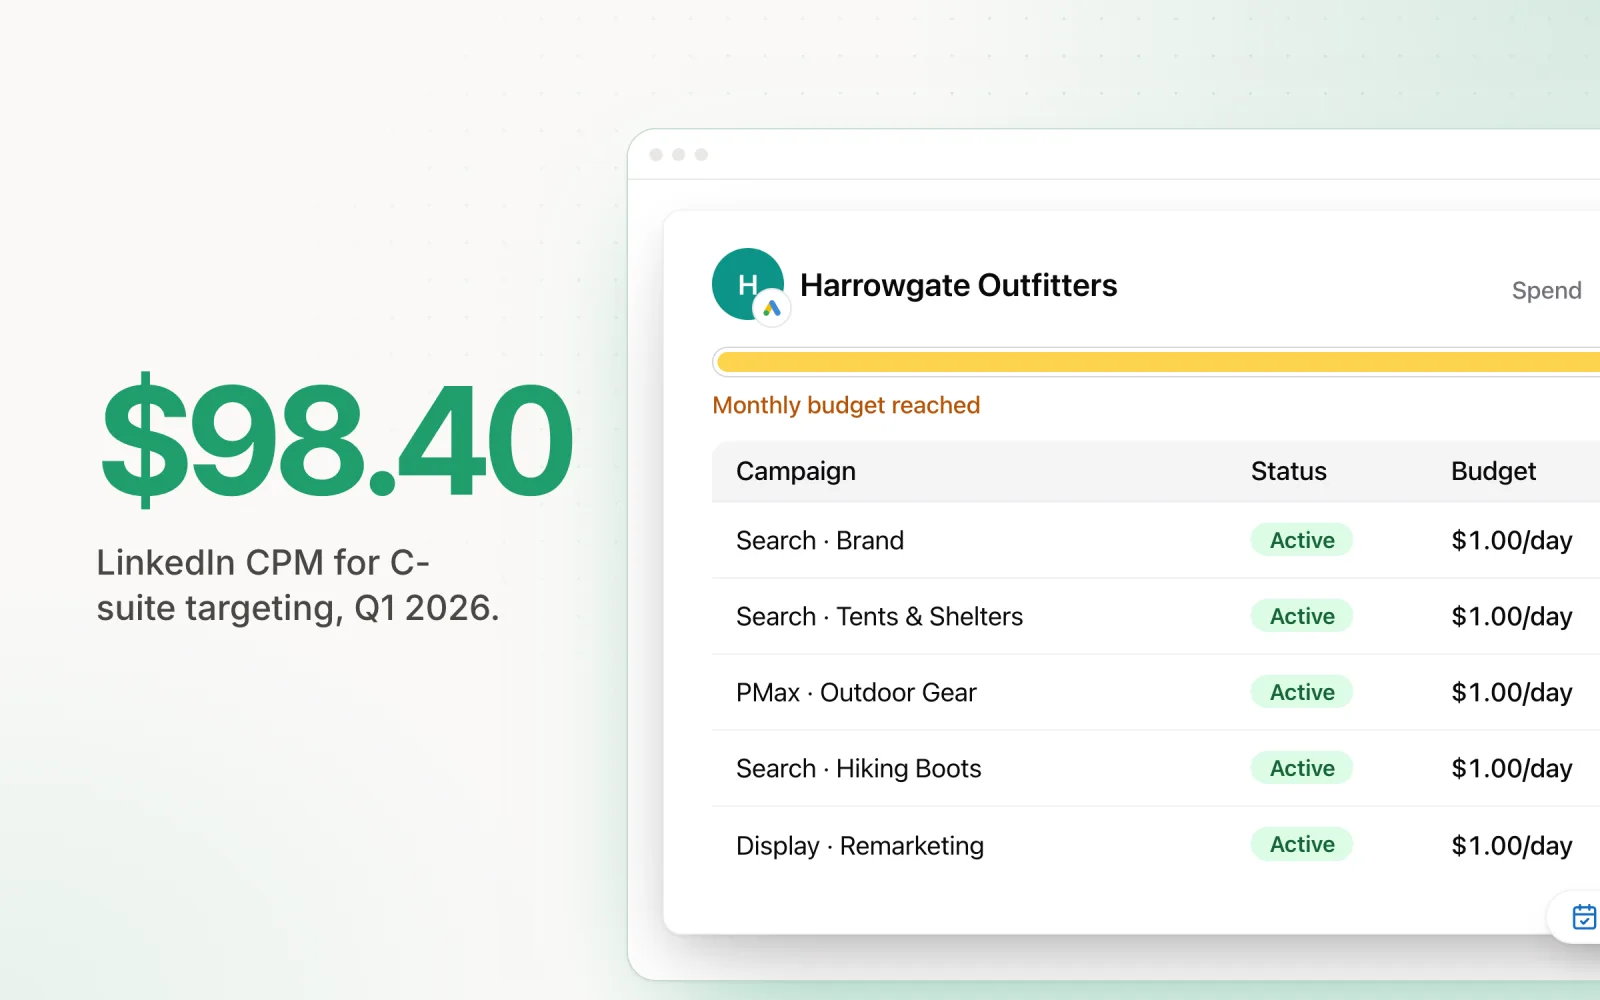
| C-suite | $98.40 | $14.85 | $278 |
Source: Digital Applied, LinkedIn Ads Benchmarks 2026, Q1 2026 data.
Five times the CPM between the bottom and top of the org chart, on the same platform, in the same quarter. That single table explains most of the disagreement between reports. A panel with a lot of C-suite ABM campaigns in it will report a high average and be telling the truth.
Narrowness does the same thing independently of seniority. The Smarketers' data, which is the enterprise-heavy end of the market, has broad North American B2B at $55–85, narrow enterprise targeting at $90–150, and ultra-narrow (small matched-account lists, layered seniority) at $150–300. Their APAC figures run about 35% lower at each tier, and India and LATAM lower again. Benly's platform-wide guidance agrees on the shape: broad B2B $20–38, narrow enterprise $38–65, ultra-narrow $65–120. Different levels, same three-times multiplier from broad to ultra-narrow.
Digital Applied also quantified what specific targeting choices do to CPC. Job title layering adds 25–40%. A company list for ABM adds 30–50%. Industry-only targeting takes 10–20% off. The cheap way to reach a decision maker is still to target their function and industry and let the creative do the qualifying.
CTR by format: documents beat images, every time
The format numbers are the one area where the sources broadly agree, which suggests they're measuring something real about the platform rather than about their panels.
| Format | Digital Applied CTR | Benly CTR | Smarketers CTR |
|---|---|---|---|
| Single image | 0.54% | 0.40–0.50% | 0.5–1.2% |
| Carousel | 0.78% | 0.50–0.60% | — |
| Video | — | 0.55–0.70% | 0.8–1.8% |
| Document ad | 1.10% | — | 1.2–2.5% |
| Thought Leader ad | 0.94% | — | 2.0–5.0% |
| Text ads | — | 0.015–0.030% | — |
Document ads at roughly double the CTR of a single image is the consistent finding, and Digital Applied has them at the lowest CPL of any format too ($78 against $104 for single image). Thought Leader ads, where the ad runs from a person's profile rather than the company page, are the other standout. The Smarketers call them the best-performing format of 2026 and their CTR range tops out at 5%. The reason is unglamorous: people scroll past logos and stop for faces.
Objective matters as much as format for CTR. Benly's split has brand awareness campaigns at 0.25–0.40% and website visit campaigns at 0.50–0.70% for the same creative, because LinkedIn's delivery system is optimising for different things. Don't compare an awareness campaign's CTR to a traffic benchmark and conclude the creative is broken.
Cost per lead: what you ask for sets the price
CPL varies more with the offer than with the industry. Digital Applied's funnel-stage split has a whitepaper download converting 9.4% of clicks at $58 a lead, a webinar 6.8% at $87, and a demo request 3.1% at $184. Benly's offer table lands in the same places: gated content $55–85, webinars $45–75, free trials $95–150, demo requests $120–200. Newsletter signups are the cheapest lead you can buy at $25–50 and, predictably, the least likely to turn into revenue.
By company size, The Smarketers have SMB-targeted campaigns at $80–200 per lead, mid-market at $180–380, and enterprise at $400–800. The more useful number in that report is cost per sales-accepted lead: $400–800 for SMB, $700–1,800 for mid-market, $2,000–6,000 for enterprise. If you report raw CPL to a client selling into enterprise, you are reporting a number that is about a quarter of what they will pay per qualified conversation.
Two mechanical points that hold across sources. Native lead gen forms convert at two to three times the rate of an external landing page (Digital Applied: 6.1% versus 1.6%) and cut CPL by 20–40%. And LinkedIn CPL has risen far faster than CPM: The Smarketers put the 2022–2026 increase at 52% for CPL against 38% for CPM, with CTR flat. The platform got dearer, and dearer per outcome faster still.
The ranges I'd plan with
Synthesising the four reports and what we see across the LinkedIn accounts on Pace, these are the numbers I'd put in a 2026 media plan for a tier-1 English-speaking market. They are deliberately wide. If your client's account sits outside them, that's a conversation, not a crisis.
| Metric | Broad B2B, function + industry | Senior or narrow (VP+, ABM lists) |
|---|---|---|
| CPM | $35–55 | $70–120 |
| CPC | $5–9 | $10–16 |
| CTR, single image | 0.45–0.65% | 0.5–0.8% |
| CTR, document / thought leader | 1.0–2.0% | 1.0–2.5% |
| CPL, gated content | $55–95 | $150–280 |
| CPL, demo / consultation | $120–200 | $250–450 |
Senior audiences click more often and cost more per click, so CTR barely moves between the columns while everything priced in dollars roughly doubles. That's the thing to explain to a client who wants to "just target CMOs": the creative won't perform worse, the invoice will be twice as big.
Where benchmarks meet the budget
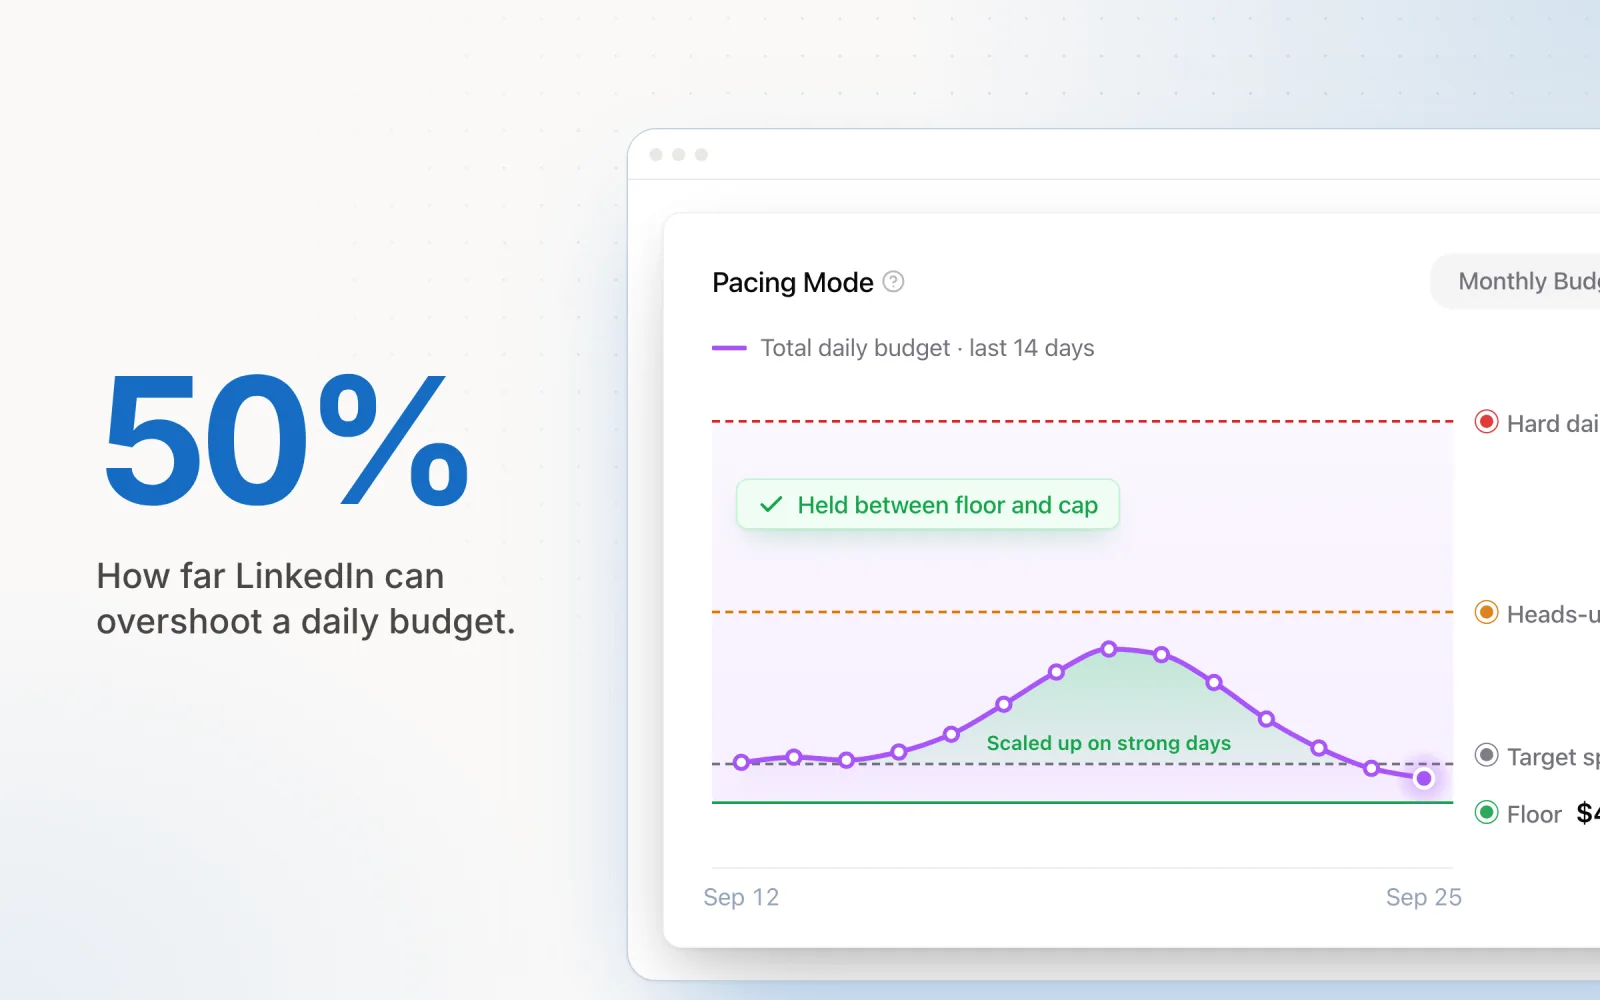
LinkedIn has one budget behaviour that makes all of the above harder to manage than it should be. Its default maximum delivery bidding will spend past a daily budget, by up to 50%, when it finds a pocket of matching users. On a platform where a single click can cost $15, a campaign that overshoots by half for three days in a row has quietly eaten a week of the monthly plan. Our LinkedIn budget pacing guide goes through the mechanics.
The benchmark problem and the pacing problem compound. If your CPM assumption was $40 and the auction is delivering at $70 because someone layered on seniority, your monthly budget buys 43% fewer impressions and LinkedIn will still spend every dollar of it, early. The way out is to watch delivery against plan daily rather than at month end. Pace does this for LinkedIn alongside Google, Meta and the other platforms: it reads campaign group budgets, including LinkedIn's group-level Budget Optimization, works out where each one will land, and flags the campaigns whose cost per result has drifted from the plan before the overspend does the flagging for you.
LinkedIn Ads benchmark FAQs
What is the average LinkedIn Ads CPM in 2026?
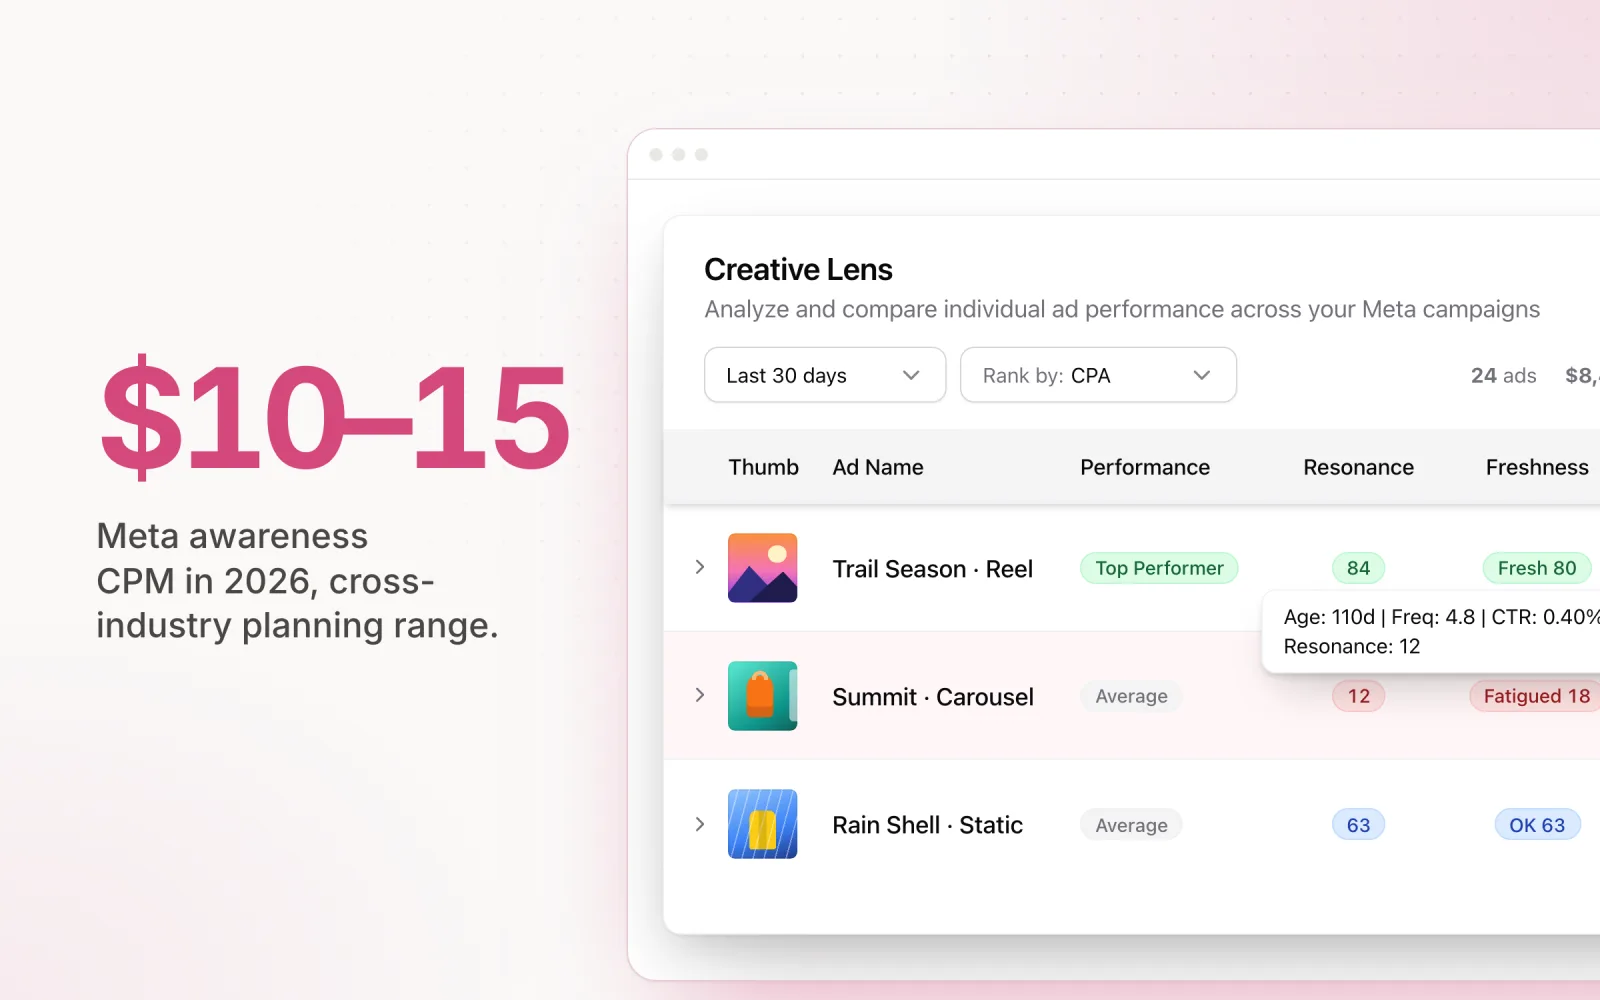
It depends on who you target. Broad B2B audiences in tier-1 markets run $34-55 CPM across the 2026 benchmark reports (Digital Applied $33.80, Benly median $38, ClickMinded $30-90 planning range). Narrow senior audiences cost far more: Digital Applied puts C-suite targeting at $98.40 CPM against $19.40 for individual contributors, and The Smarketers' enterprise-focused panel reports $55-85 for broad North American B2B and $150-300 for ultra-narrow targeting.
What is a good CTR for LinkedIn Ads in 2026?
For single-image Sponsored Content, 0.45-0.65% is average and anything over 0.8% is good. Document ads roughly double that at around 1.1%, and Thought Leader ads run higher again. Lead gen forms are measured on completion rate rather than CTR, where 8-15% is typical. Brand awareness campaigns sit lower (0.25-0.40%) because LinkedIn optimises them for reach, not clicks.
What is a good cost per lead on LinkedIn?
For a gated asset like a report or webinar aimed at a broad B2B audience, $55-95 per lead is the 2026 range across sources. Demo or consultation requests run $120-200. Enterprise and C-suite targeting pushes CPL into the $200-400 range and beyond. Cost per sales-accepted lead is the number that actually matters, and it is typically two to four times the raw CPL.

Jordan Parrello
Founder of Pace. Ran an agency pacing sheet by hand for years before building the thing that checks it every 5 minutes. About Pace or LinkedIn