What is share of voice?
Share of voice is the percentage of total advertising visibility your brand captures in a given market or channel relative to your competitors. If there are 10,000 opportunities for your ad to appear and your ad shows up 4,000 times, your share of voice is 40%. The remaining 60% belongs to everyone else competing for the same audience.
The concept originated in traditional media (television, radio, and print), where share of voice measured the proportion of total ad spend or ad placements a brand held within a category. A car manufacturer running 30% of all automotive TV ads in a quarter held a 30% share of voice. The share of voice meaning has not really shifted since. What has shifted is how precisely we can measure it.
Television SoV required panel data and audience modelling. PPC share of voice is calculated from actual auction data. Every impression either went to you or it did not. That precision makes advertising share of voice one of the most reliable competitive metrics media buyers have.
Why does it matter? The Ehrenberg-Bass Institute established that brands whose share of voice exceeds their share of market tend to grow, while brands whose share of voice falls below their market share tend to shrink. The relationship is known as excess share of voice (ESOV), and it holds across industries and channels. In PPC terms: if your competitors are winning more of the available impressions than you, they are probably taking market share from you. If you are winning more, you are probably taking it from them.
Share of voice in PPC vs. traditional marketing
In PPC, share of voice is measured primarily through impression share, a metric the ad platforms calculate and report natively. Google Ads tells you exactly what percentage of eligible impressions your ads received, broken down by the reason you missed the rest. That is a different setup from how share of voice works in broader marketing contexts.
In traditional share of voice marketing, the metric covers multiple channels at once. A brand's total share of voice might include paid media (TV, radio, outdoor, digital ads), earned media (press coverage, reviews, word of mouth), owned media (social posts, email, content), and organic search visibility. Calculating a true cross-channel share of voice means aggregating data from disparate sources, usually with a lot of estimation in the mix.
This article sticks to paid search and paid social. The advertising share of voice you can measure directly from your ad platforms. Within PPC, share of voice is more granular and more actionable than in any other marketing channel. You can see your current share of voice and exactly why you are losing the rest: budget constraints, bid competitiveness, quality score issues, or targeting limitations.
PPC share of voice does not exist in isolation though. A brand that dominates paid search impressions but has no organic visibility, no social presence, and no PR coverage has a fragile competitive position. The strongest brands hold share of voice across multiple channels (our breakdown of when to use organic vs paid search covers how to balance the two). But for agencies making day-to-day budget and bidding decisions, PPC impression share is the share of voice metric that matters most. It is the one you can act on today.
How to calculate share of voice
The basic share of voice calculation is:
SoV = (Your impressions / Total available impressions) × 100
In Google Ads, the formula maps directly to Search Impression Share. If your campaigns received 15,000 impressions and Google estimates there were 25,000 eligible impressions, your search impression share, and therefore your PPC share of voice, is 60%.
Google Ads breaks impression share loss into two categories. You need both for any meaningful share of voice calculation.
Search Budget Lost Impression Share. The percentage of eligible impressions you missed because your daily budget ran out before the day ended. If your budget lost impression share is 20%, your campaigns stopped showing for roughly a fifth of the available queries because the budget was gone. The fix is usually obvious: increase budget, improve pacing, or narrow targeting to concentrate spend on higher-value queries. For agencies managing pacing across multiple accounts, this is a direct signal of where more spend would capture more visibility. Our guide on landing ad spend on target covers the pacing mechanics in detail.
Search Rank Lost Impression Share. The percentage of eligible impressions you missed because your Ad Rank was not competitive enough. Ad Rank is determined by your bid, quality score, and expected impact of extensions. High rank-lost impression share means either your bids are too low for the auctions you are entering, your quality scores are dragging you down, or both. Unlike budget-lost impression share, you cannot fix this by spending more. It requires better ad relevance, landing page experience, or expected click-through rate.
To find these metrics in Google Ads, navigate to the Campaigns view, click Columns, select Modify Columns, and add "Search impr. share", "Search lost IS (budget)", and "Search lost IS (rank)" from the Competitive Metrics section. Those three columns give you a full picture of your share of voice and why you are not capturing the rest.
A worked example. Suppose a campaign has 55% search impression share, 15% budget-lost impression share, and 30% rank-lost impression share. The three sum to 100%. So 55% of the time your ad appeared, 15% of the time it could have appeared but your budget ran out, and 30% of the time it could have appeared but your Ad Rank was not competitive. The SoV analysis immediately tells you that fixing rank issues (quality scores, bids) has twice the impact potential as adding budget.
Share of voice metrics across platforms
Measuring share of voice consistently across platforms is one of the harder bits of multi-platform ad management. Each platform reports different metrics, at different granularity, with different definitions. Here is how share of voice metrics work on each of the big platforms.
Google Ads. Google has the most complete SoV reporting in the industry. Search Impression Share is the primary metric, available at the campaign, ad group, and keyword level. Auction Insights adds competitive context: overlap rate (how often a specific competitor appears alongside you), position above rate (how often they rank higher), top of page rate, and absolute top of page rate. Impression share and auction insights together give you your own share of voice plus a directional read on who else holds the rest. Display and Shopping campaigns also report impression share, though the metric is less precise because display auction eligibility is messier.
Microsoft Ads. Microsoft mirrors Google's impression share metrics closely. Search impression share, budget-lost impression share, and rank-lost impression share are all there with the same definitions. Auction insights are available too, though the competitive landscape is usually less crowded than Google's. For agencies running both platforms, the symmetry makes cross-platform SoV analysis pretty straightforward.
Meta Ads. Meta does not have an impression share metric equivalent to Google's. The platform runs on a different auction model. You are not bidding on keywords but on audiences, and the total addressable audience fluctuates based on targeting, placement, and frequency. The closest proxies on Meta are Reach (unique people who saw your ad) compared to your audience size, and Estimated Ad Recall Lift. Neither is a true SoV metric. For Meta, share of voice is better understood through competitive intelligence tools that estimate competitor spend in your category, rather than through native platform data.
LinkedIn Ads. LinkedIn reports a Share of Voice metric in campaign reporting that shows your percentage of impressions among competitors targeting similar audiences. Useful directionally, though the competitive set is less transparent than Google's auction insights. LinkedIn also reports demographic data on who is seeing your ads, which helps you check whether your share of voice is landing on the right audience segments.
The catch with cross-platform share of voice: you cannot just add impression share percentages from different platforms together. A 60% impression share on Google Search, a 35% on Microsoft, and unknown coverage on Meta do not average to anything meaningful. Each platform is a different audience, different intent signals, different auction dynamics. True cross-platform SoV analysis means looking at each platform individually, then using cross-platform monitoring tools to identify where your competitive position is strongest and where it needs investment.
Using share of voice to guide strategy
Share of voice data is only useful when it changes a decision. Here is how to translate SoV metrics into actions that move campaign performance.
The ESOV growth principle. The Ehrenberg-Bass research on excess share of voice is the framework I keep coming back to when interpreting SoV data. If your share of voice exceeds your share of market, you tend to grow. If it falls below, you tend to shrink. For PPC, that becomes a practical question: are you winning enough of the available impressions in your category to grow market position, or are competitors outpacing you?
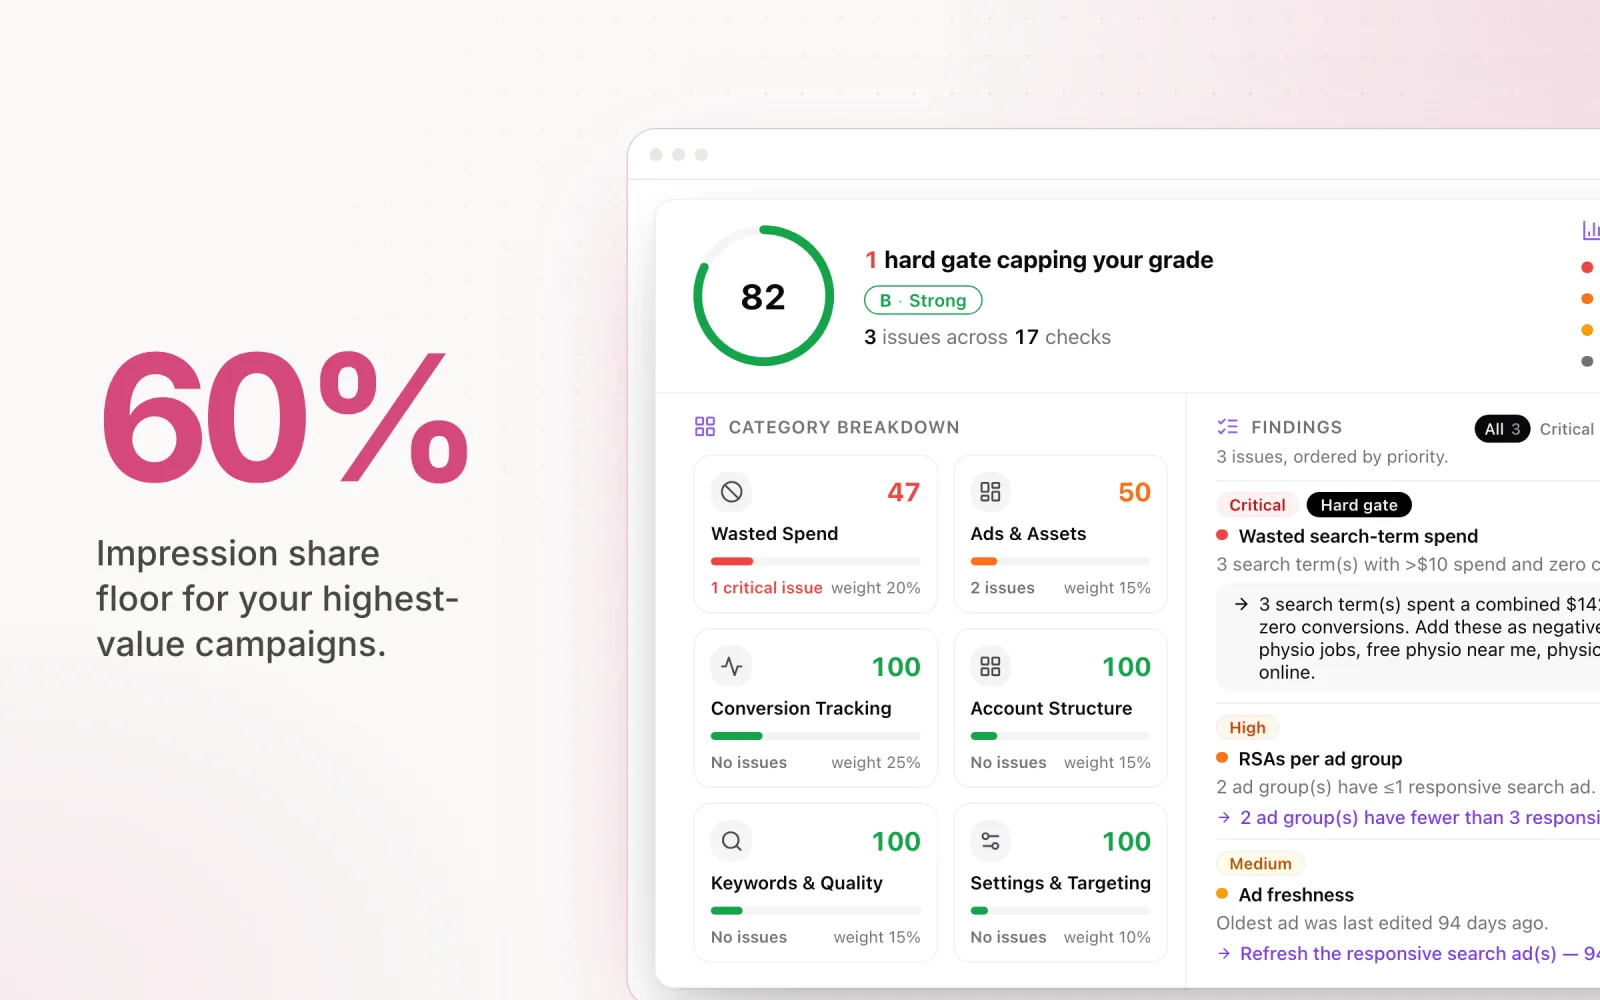
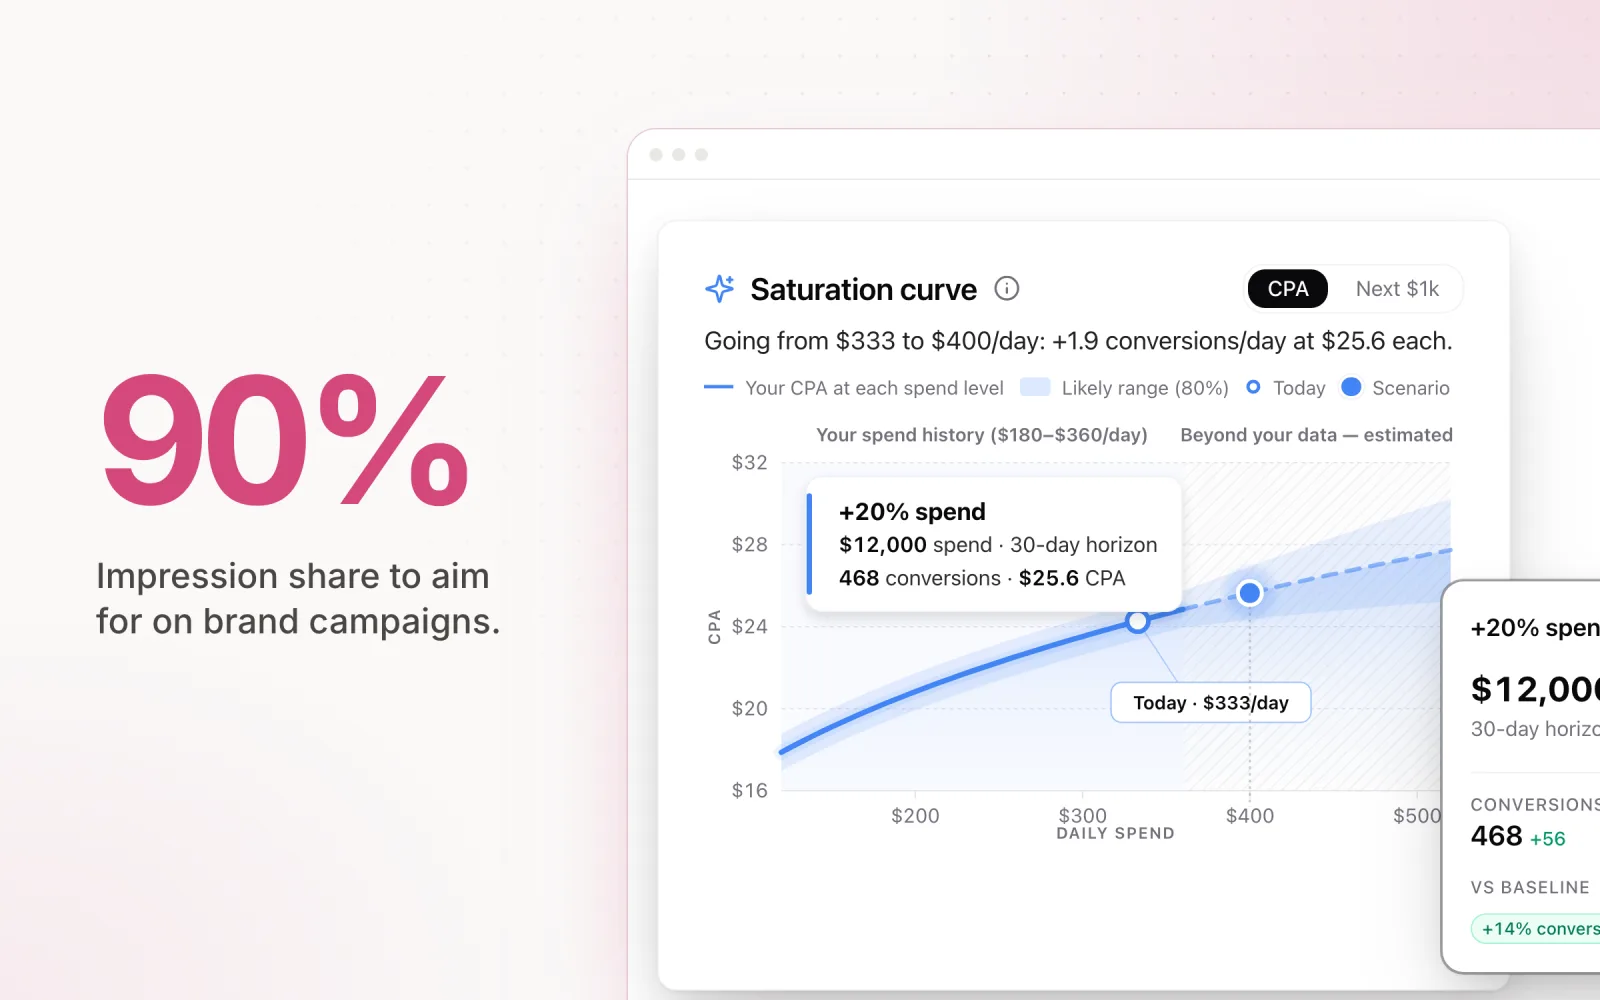
Agencies can use the principle to set impression share targets by campaign type. Brand campaigns should aim for 90% or higher. If someone searches for your client's brand name, your client's ad should appear almost every time. High-intent non-brand campaigns (keywords with clear purchase intent) should target 60-80% impression share, depending on budget. Broader prospecting or awareness campaigns may sit at 30-50%, which is fine when the goal is reach rather than direct response.
Budget decisions from impression share loss. Budget-lost impression share is the cleanest signal for where additional spend would capture additional visibility. If a campaign with strong ROAS has 25% budget-lost impression share, it is leaving revenue on the table every day. The math: if you are spending $3,000/month and capturing 60% of impressions, getting to 80% needs roughly $4,000/month (assuming linear scaling, which is roughly true in practice). Whether the additional spend is worth it depends on whether the marginal conversions from the extra 20% impression share are profitable at your target CPA or ROAS.
Quality and bid issues from rank-lost impression share. Rank-lost impression share calls for a different response than budget-lost. If you are losing 30% of impressions due to rank, the problem is competitiveness, not budget. Three levers: raise bids (which increases cost), improve quality scores (which increases competitiveness without increasing cost), or improve ad extensions and formats (which boost expected CTR and therefore Ad Rank). For more on bidding, see our guide on Smart Bidding in Google Ads.
When low share of voice is fine. Not every campaign needs high impression share. Tightly targeted niche campaigns may intentionally hold low impression share across a broader keyword set because they are only bidding on the most relevant subset of queries. A B2B SaaS company targeting "enterprise fleet management software" does not need to compete for every query containing "fleet management". Most of those are irrelevant to enterprise sales. Low SoV in a broad category is fine if SoV within your actual target queries is high.
Competitive analysis with Auction Insights. Google's Auction Insights report is one of the most underused tools in PPC. Beyond your own impression share, it tells you who you are competing against and how they are performing. Watch for: a new domain appearing with 30%+ overlap rate (a competitor entering your space aggressively), an existing competitor's position above rate jumping 15 points in a month (they have raised bids or improved quality), or your own outranking share dropping on brand terms (someone has started bidding on your brand, and that needs a defensive response). Pull auction insights monthly at minimum and bake it into your standard paid search analysis workflow.
Share of voice analysis: a step-by-step framework
A structured SoV analysis takes 30 to 45 minutes per account and should be part of your monthly review. Here is a five-step framework that turns raw impression share data into prioritised actions.
Step 1: Pull impression share data by campaign. Export the campaign report with Search Impression Share, Search Lost IS (Budget), and Search Lost IS (Rank) columns. Sort by spend descending. Start with the campaigns that matter most financially. Record current impression share for each campaign alongside last month's numbers so trends are visible.
Step 2: Flag campaigns with >20% budget-lost impression share. These campaigns are underfunded relative to demand. For each one, calculate the additional monthly budget needed: (current spend / current impression share) × target impression share = required spend. If a campaign spending $5,000/month has 50% impression share and you want 70%, that is ($5,000 / 0.50) × 0.70 = $7,000/month. Whether to actually increase depends on efficiency. Is CPA within target? Is ROAS acceptable? If yes, this is one of the cleanest ROI-positive moves you can make in PPC.
Step 3: Flag campaigns with >20% rank-lost impression share. These campaigns have competitiveness issues. For each one, check quality scores on the top-spending keywords. Anything below 6 is pulling down your Ad Rank. Check ad relevance. Are the ads tightly aligned with the keyword themes in each ad group? Check landing page experience. Is the destination page fast, relevant, and mobile-friendly? Rank-lost impression share above 30% almost always has a quality score component on top of bidding. Address quality first. It reduces costs while improving competitiveness.
Step 4: Compare with Auction Insights. Pull the Auction Insights report for your top five campaigns by spend. Identify the top three competitors by overlap rate in each. Check whether their impression share, position above rate, or top of page rate has shifted meaningfully (more than 10 percentage points) over the past three months. New or noticeably more aggressive competitors explain drops in your impression share that are not caused by your own budget or quality issues.
Step 5: Prioritise where to invest. Rank your opportunities by potential impact. Campaigns with high ROAS or low CPA and high budget-lost impression share go to the top. Profitable campaigns being constrained by budget. Campaigns with high rank-lost impression share and quality score issues go next. They need optimisation work. Campaigns where competitors have got newly aggressive go last. These need a strategic call about whether to compete harder or pivot to different keyword territories.
The framework works for any account size. For agencies managing 20 or more accounts, automate step 1 by scheduling impression share reports to export weekly. The analysis in steps 2 through 5 needs human judgment. The data gathering does not.
Tools for tracking share of voice
The tools you reach for depend on whether you need platform-native reporting, cross-platform visibility, or competitive intelligence beyond your own ad accounts.
Google Ads native reports. For Google-only advertisers, the built-in impression share columns and Auction Insights report cover everything needed for SoV analysis. Set up a saved report with impression share metrics at the campaign level, scheduled to email weekly. The catch: it only works for Google. You get nothing for Meta, LinkedIn, or Microsoft from this view.
Microsoft Ads native reports. Same impression share metrics as Google, with the same reporting capabilities. For agencies running both Google and Microsoft, pulling reports from each and comparing them side by side gives you a reasonable view of paid search share of voice. Still manual, but functional for small portfolios.
SEMrush and Ahrefs. For organic share of voice (which complements paid SoV), tools like SEMrush and Ahrefs track keyword rankings and visibility across search results. SEMrush's "Position Tracking" tool calculates a share of voice metric based on estimated organic traffic share for tracked keywords. Useful for brands that want a complete picture of search visibility across both paid and organic.
Pace. This is what we built. For agencies managing share of voice metrics across Google, Meta, TikTok, LinkedIn, Microsoft, and Reddit Ads, Pace provides cross-platform impression share monitoring from a single dashboard. Instead of pulling reports from four platforms and assembling them in a spreadsheet, Pace aggregates impression share alongside spend, CPA, ROAS, and other performance metrics. One unified view of where your share of voice is strong and where it needs attention. Pace's Findings flag meaningful impression share drops automatically, so you do not have to wait for a scheduled review to find out a competitor has entered the auction aggressively or a budget constraint is costing you visibility.
Google Ads scripts. For teams with JavaScript chops, custom Google Ads scripts can automate SoV monitoring at any cadence. A common pattern: pull impression share by campaign daily, log it to a Google Sheet, send a Slack or email alert when any campaign's impression share drops below a defined threshold. Near-real-time SoV monitoring for Google Ads at no cost beyond the development and maintenance effort.
Frequently asked questions
What is share of voice in advertising?
Share of voice (SoV) in advertising is the percentage of total advertising visibility your brand captures relative to competitors in a given market or channel. In PPC, share of voice is measured through impression share, the percentage of available impressions your ads actually win. A 40% share of voice means your ads appear in 40% of eligible auctions for your targeted keywords or audiences.
How do you calculate share of voice?
The basic share of voice calculation is: SoV = (Your impressions / Total available impressions) × 100. In Google Ads, this maps directly to Search Impression Share. For example, if your ads received 6,000 impressions out of 10,000 eligible impressions, your share of voice is 60%. You can find this data in the Campaigns view by adding the Impression Share columns.
What is a good share of voice?
A good share of voice depends on the campaign type. For brand campaigns, aim for 90% or higher. You should dominate your own brand terms. For high-intent non-brand campaigns, 60-80% is a strong target. For broad prospecting or awareness campaigns, 30-50% may be acceptable depending on budget constraints. The key benchmark is the Ehrenberg-Bass principle: your share of voice should exceed your share of market if you want to grow.
What is the difference between share of voice and impression share?
Impression share is the PPC-specific metric that measures how often your ads appear out of total eligible impressions. Share of voice is the broader marketing concept that covers all forms of advertising visibility, including paid, organic, social, and PR. In practice, PPC professionals often use the terms interchangeably because impression share is the primary way to measure share of voice in paid search. A complete share of voice analysis would also include organic search visibility, social media mentions, and earned media coverage.
Pace tracks impression share and performance metrics across Google, Meta, TikTok, LinkedIn, Microsoft, and Reddit Ads, giving agencies a unified view of their advertising share of voice without switching between platforms. Start a free trial to see your cross-platform share of voice in one dashboard.

Jordan Parrello
Founder of Pace. Ran an agency pacing sheet by hand for years before building the thing that checks it every 5 minutes. About Pace or LinkedIn